29
/es/
es
AIzaSyAYiBZKx7MnpbEhh9jyipgxe19OcubqV5w
April 1, 2024
86630
Bhutan
BTN
true
2
1
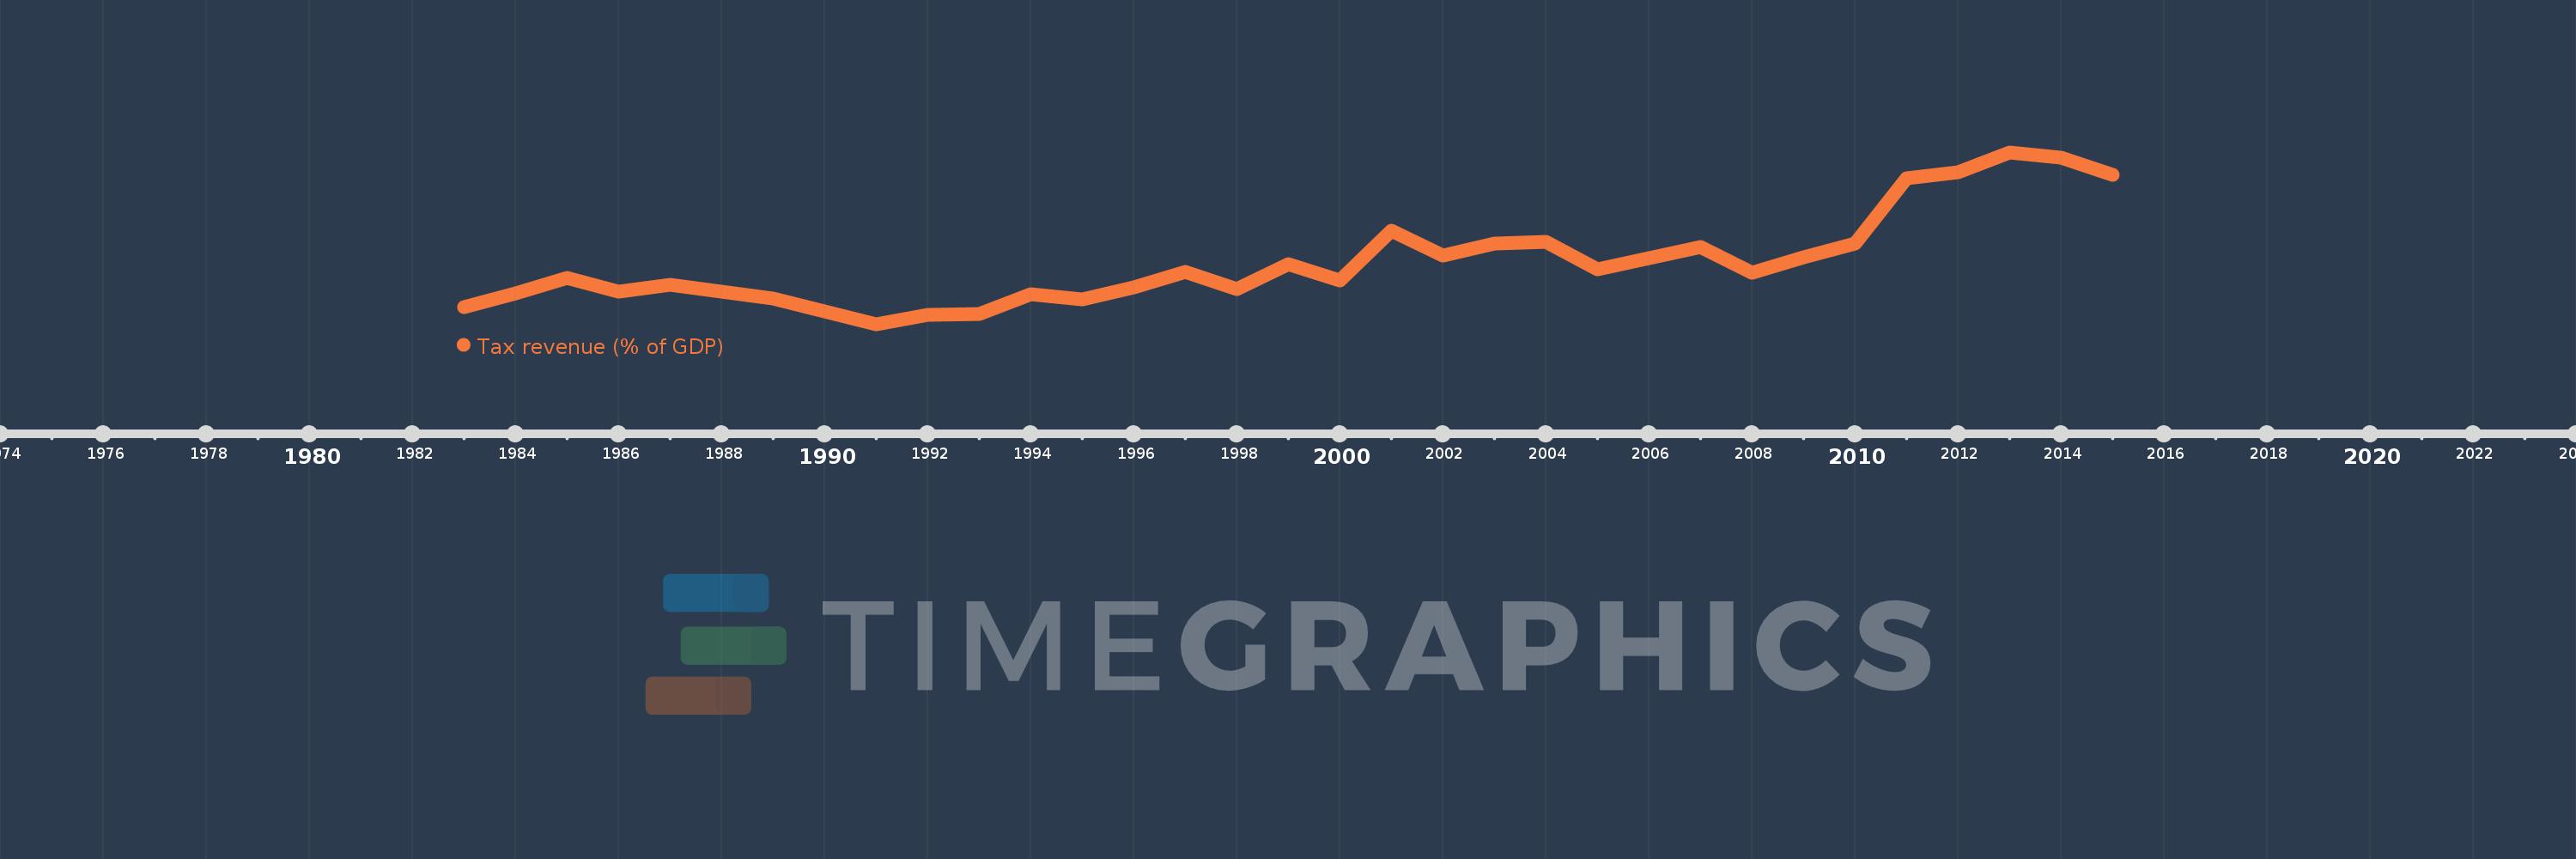
Tax revenue (% of GDP)
2015,2014,2013,2012,2011,2010,2009,2008,2007,2006,2005,2004,2003,2002,2001,2000,1999,1998,1997,1996,1995,1994,1993,1992,1991,1990,1989,1987,1986,1985,1984,1983
Estas estadísticas en otros países:
AfghanistanAlbaniaAlgeriaAngolaAntigua and BarbudaArgentinaArmeniaAustraliaAustriaAzerbaijanBahamas, TheBahrainBangladeshBarbadosBelarusBelgiumBelizeBeninBhutanBoliviaBosnia and HerzegovinaBotswanaBrazilBulgariaBurkina FasoBurundiCabo VerdeCambodiaCanadaCaribbean small statesCentral African RepublicCentral Europe and the BalticsChileChinaColombiaCongo, Dem. Rep.Congo, Rep.Costa RicaCote d'IvoireCroatiaCyprusCzech RepublicDenmarkDominicaDominican RepublicEarly-demographic dividendEast Asia & PacificEast Asia & Pacific (excluding high income)East Asia & Pacific (IDA & IBRD countries)Egypt, Arab Rep.El SalvadorEquatorial GuineaEstoniaEthiopiaEuro areaEurope & Central AsiaEurope & Central Asia (excluding high income)Europe & Central Asia (IDA & IBRD countries)European UnionFijiFinlandFranceGambia, TheGeorgiaGermanyGhanaGreeceGrenadaGuatemalaHeavily indebted poor countries (HIPC)High incomeHondurasHong Kong SAR, ChinaHungaryIBRD onlyIcelandIDA & IBRD totalIDA blendIDA onlyIDA totalIndiaIndonesiaIran, Islamic Rep.IraqIrelandIsraelItalyJamaicaJapanJordanKazakhstanKenyaKiribatiKorea, Rep.KuwaitKyrgyz RepublicLao PDRLate-demographic dividendLatin America & Caribbean Latin America & Caribbean (excluding high income)Latin America & the Caribbean (IDA & IBRD countries)LatviaLeast developed countries: UN classificationLebanonLesothoLiberiaLithuaniaLow & middle incomeLow incomeLower middle incomeLuxembourgMacao SAR, ChinaMacedonia, FYRMadagascarMalawiMalaysiaMaldivesMaliMaltaMauritiusMexicoMicronesia, Fed. Sts.Middle East & North Africa (excluding high income)Middle East & North Africa (IDA & IBRD countries)Middle incomeMoldovaMongoliaMoroccoMozambiqueMyanmarNamibiaNepalNetherlandsNew ZealandNicaraguaNigeriaNorth AmericaNorwayOECD membersOmanOther small statesPacific island small statesPakistanPanamaPapua New GuineaParaguayPeruPhilippinesPolandPortugalPost-demographic dividendPre-demographic dividendQatarRomaniaRussian FederationRwandaSamoaSan MarinoSao Tome and PrincipeSenegalSerbiaSeychellesSierra LeoneSingaporeSlovak RepublicSloveniaSmall statesSolomon IslandsSouth AfricaSouth AsiaSouth Asia (IDA & IBRD)SpainSri LankaSt. Kitts and NevisSt. LuciaSt. Vincent and the GrenadinesSub-Saharan Africa Sub-Saharan Africa (excluding high income)Sub-Saharan Africa (IDA & IBRD countries)SurinameSwazilandSwedenSwitzerlandSyrian Arab RepublicTajikistanTanzaniaThailandTimor-LesteTogoTrinidad and TobagoTunisiaTurkeyUgandaUkraineUnited Arab EmiratesUnited KingdomUnited StatesUpper middle incomeUruguayVanuatuVenezuela, RBVietnamWest Bank and GazaWorldYemen, Rep.ZambiaZimbabwe línea de tiempo (timeline):
En esta escala de tiempo se presenta un gráfico de 1983 y 2015 de Bhutan. Los datos de 1982 están ausentes. El número de observaciones reales por fecha: 32.
Fuente (nombre):
Indicadores del desarrollo mundial
Fuente (organización):
International Monetary Fund, Government Finance Statistics Yearbook and data files, and World Bank and OECD GDP estimates.
Categorías:
Public Sector
Se ha actualizado:
23 abr 2017 año
Los indicadores de los cambios de valor en los últimos años
Mínimo:
4.414
1 ene 1991 año
Máximo:
14.704
1 ene 2013 año
A la fecha de observación
Valor
Cambio absoluto
El cambio con respecto al valor anterior
1 ene 1983 año
5.43
+5.43
0.0%
1 ene 1984 año
6.278
+0.849
15.63%
1 ene 1985 año
7.208
+0.93
14.81%
1 ene 1986 año
6.379
-0.829
-11.5%
1 ene 1987 año
6.754
+0.374
5.87%
1 ene 1989 año
5.97
-0.783
-11.6%
1 ene 1990 año
5.191
-0.779
-13.05%
1 ene 1991 año
4.414
-0.777
-14.97%
1 ene 1992 año
4.952
+0.539
12.2%
1 ene 1993 año
5.049
+0.096
1.94%
1 ene 1994 año
6.234
+1.185
23.47%
1 ene 1995 año
5.925
-0.309
-4.96%
1 ene 1996 año
6.612
+0.687
11.6%
1 ene 1997 año
7.53
+0.919
13.89%
1 ene 1998 año
6.539
-0.991
-13.16%
1 ene 1999 año
8.014
+1.475
22.55%
1 ene 2000 año
7.015
-0.999
-12.46%
1 ene 2001 año
10.018
+3.003
42.8%
1 ene 2002 año
8.527
-1.491
-14.88%
1 ene 2003 año
9.249
+0.722
8.46%
1 ene 2004 año
9.366
+0.116
1.26%
1 ene 2005 año
7.683
-1.683
-17.97%
1 ene 2006 año
8.347
+0.664
8.64%
1 ene 2007 año
9.031
+0.684
8.2%
1 ene 2008 año
7.519
-1.512
-16.74%
1 ene 2009 año
8.416
+0.896
11.92%
1 ene 2010 año
9.236
+0.82
9.74%
1 ene 2011 año
13.143
+3.908
42.31%
1 ene 2012 año
13.508
+0.364
2.77%
1 ene 2013 año
14.704
+1.197
8.86%
1 ene 2014 año
14.378
-0.326
-2.22%
1 ene 2015 año
13.337
-1.041
-7.24%
Ranking de los países por los datos estadísticos actuales


Comentarios: