29
/es/
es
AIzaSyAYiBZKx7MnpbEhh9jyipgxe19OcubqV5w
April 1, 2024
86294
Bhutan
BTN
true
2
1
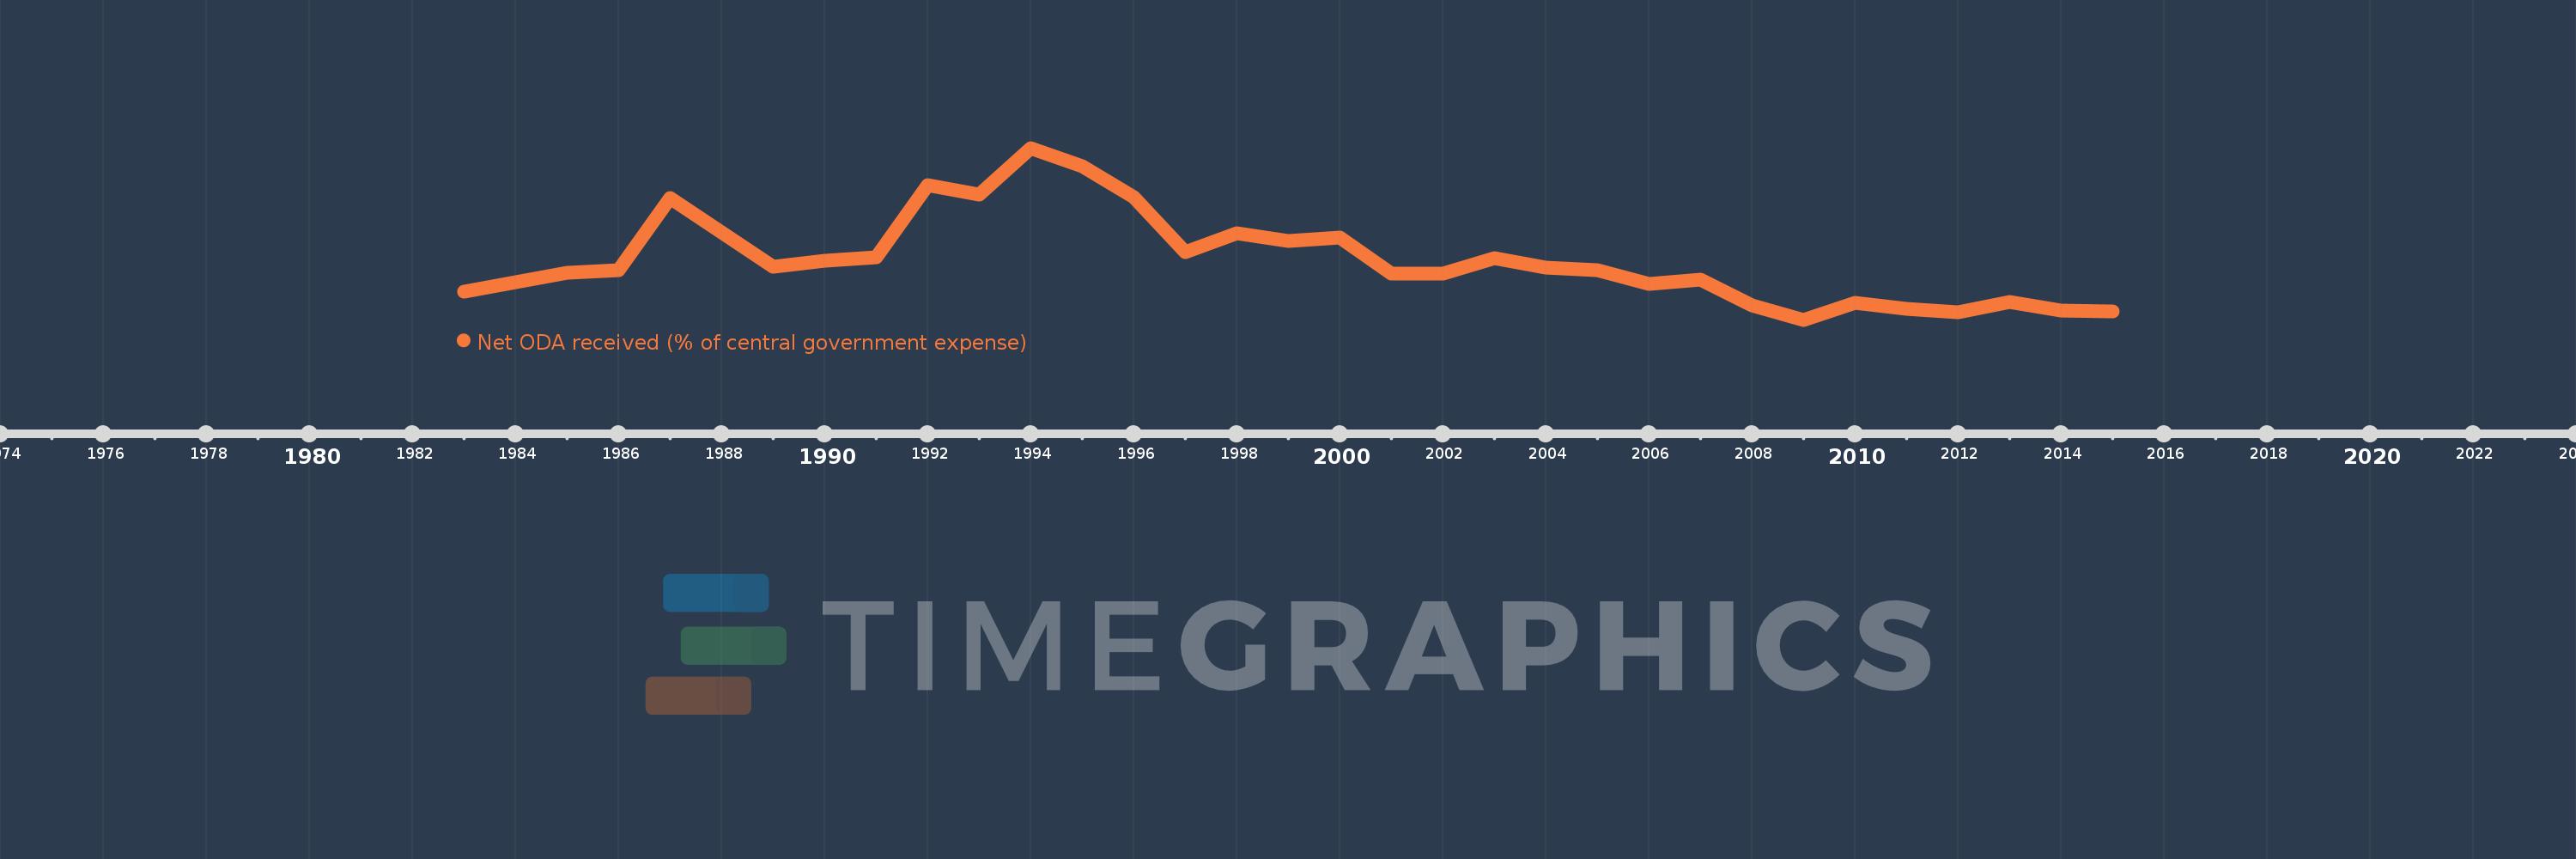
Net ODA received (% of central government expense)
2015,2014,2013,2012,2011,2010,2009,2008,2007,2006,2005,2004,2003,2002,2001,2000,1999,1998,1997,1996,1995,1994,1993,1992,1991,1990,1989,1987,1986,1985,1984,1983
Estas estadísticas en otros países:
AfghanistanAlbaniaAlgeriaAngolaAntigua and BarbudaArmeniaAzerbaijanBahamas, TheBahrainBangladeshBarbadosBelarusBelizeBeninBhutanBoliviaBosnia and HerzegovinaBotswanaBrazilBurkina FasoBurundiCabo VerdeCambodiaCentral African RepublicChileColombiaCongo, Dem. Rep.Congo, Rep.Costa RicaCote d'IvoireCroatiaCyprusDominicaDominican RepublicEgypt, Arab Rep.El SalvadorEquatorial GuineaEthiopiaFijiGambia, TheGeorgiaGhanaGrenadaGuatemalaHondurasIndiaIndonesiaIran, Islamic Rep.IraqIsraelJamaicaJordanKazakhstanKenyaKiribatiKorea, Rep.KuwaitKyrgyz RepublicLao PDRLebanonLesothoLiberiaMacao SAR, ChinaMacedonia, FYRMadagascarMalawiMalaysiaMaldivesMaliMaltaMauritiusMexicoMicronesia, Fed. Sts.MoldovaMongoliaMoroccoMozambiqueMyanmarNamibiaNepalNicaraguaNigeriaOmanPakistanPanamaPapua New GuineaParaguayPeruPhilippinesRwandaSamoaSao Tome and PrincipeSenegalSerbiaSeychellesSierra LeoneSingaporeSloveniaSolomon IslandsSouth AfricaSri LankaSt. Kitts and NevisSt. LuciaSurinameSwazilandSyrian Arab RepublicTajikistanTanzaniaThailandTimor-LesteTogoTrinidad and TobagoTunisiaTurkeyUgandaUkraineUruguayVanuatuVenezuela, RBVietnamWest Bank and GazaYemen, Rep.ZambiaZimbabwe línea de tiempo (timeline):
En esta escala de tiempo se presenta un gráfico de 1983 y 2015 de Bhutan. Los datos de 1982 están ausentes. El número de observaciones reales por fecha: 32.
Fuente (nombre):
Indicadores del desarrollo mundial
Fuente (organización):
Development Assistance Committee of the Organisation for Economic Co-operation and Development, Geographical Distribution of Financial Flows to Developing Countries, Development Co-operation Report, and International Development Statistics database. Data are available online at: www.oecd.org/dac/stats/idsonline. IMF central government expense estimates are used for the denominator.
Categorías:
Aid Effectiveness
Se ha actualizado:
23 abr 2017 año
Los indicadores de los cambios de valor en los últimos años
Mínimo:
30.476
1 ene 2009 año
Máximo:
151.371
1 ene 1994 año
A la fecha de observación
Valor
Cambio absoluto
El cambio con respecto al valor anterior
1 ene 1983 año
49.965
+49.965
0.0%
1 ene 1984 año
56.959
+6.994
14.0%
1 ene 1985 año
63.773
+6.814
11.96%
1 ene 1986 año
65.534
+1.762
2.76%
1 ene 1987 año
116.164
+50.629
77.26%
1 ene 1989 año
67.548
-48.616
-41.85%
1 ene 1990 año
71.844
+4.296
6.36%
1 ene 1991 año
74.642
+2.798
3.89%
1 ene 1992 año
124.986
+50.344
67.45%
1 ene 1993 año
118.677
-6.309
-5.05%
1 ene 1994 año
151.371
+32.695
27.55%
1 ene 1995 año
138.684
-12.687
-8.38%
1 ene 1996 año
116.585
-22.099
-15.94%
1 ene 1997 año
77.755
-38.83
-33.31%
1 ene 1998 año
91.315
+13.559
17.44%
1 ene 1999 año
86.037
-5.278
-5.78%
1 ene 2000 año
88.135
+2.099
2.44%
1 ene 2001 año
63.01
-25.126
-28.51%
1 ene 2002 año
62.901
-0.109
-0.17%
1 ene 2003 año
74.097
+11.196
17.8%
1 ene 2004 año
67.045
-7.052
-9.52%
1 ene 2005 año
65.325
-1.72
-2.57%
1 ene 2006 año
55.664
-9.661
-14.79%
1 ene 2007 año
58.611
+2.947
5.29%
1 ene 2008 año
40.852
-17.759
-30.3%
1 ene 2009 año
30.476
-10.377
-25.4%
1 ene 2010 año
42.569
+12.093
39.68%
1 ene 2011 año
37.921
-4.648
-10.92%
1 ene 2012 año
35.845
-2.076
-5.47%
1 ene 2013 año
43.275
+7.43
20.73%
1 ene 2014 año
37.088
-6.187
-14.3%
1 ene 2015 año
36.471
-0.617
-1.66%
Ranking de los países por los datos estadísticos actuales


Comentarios: