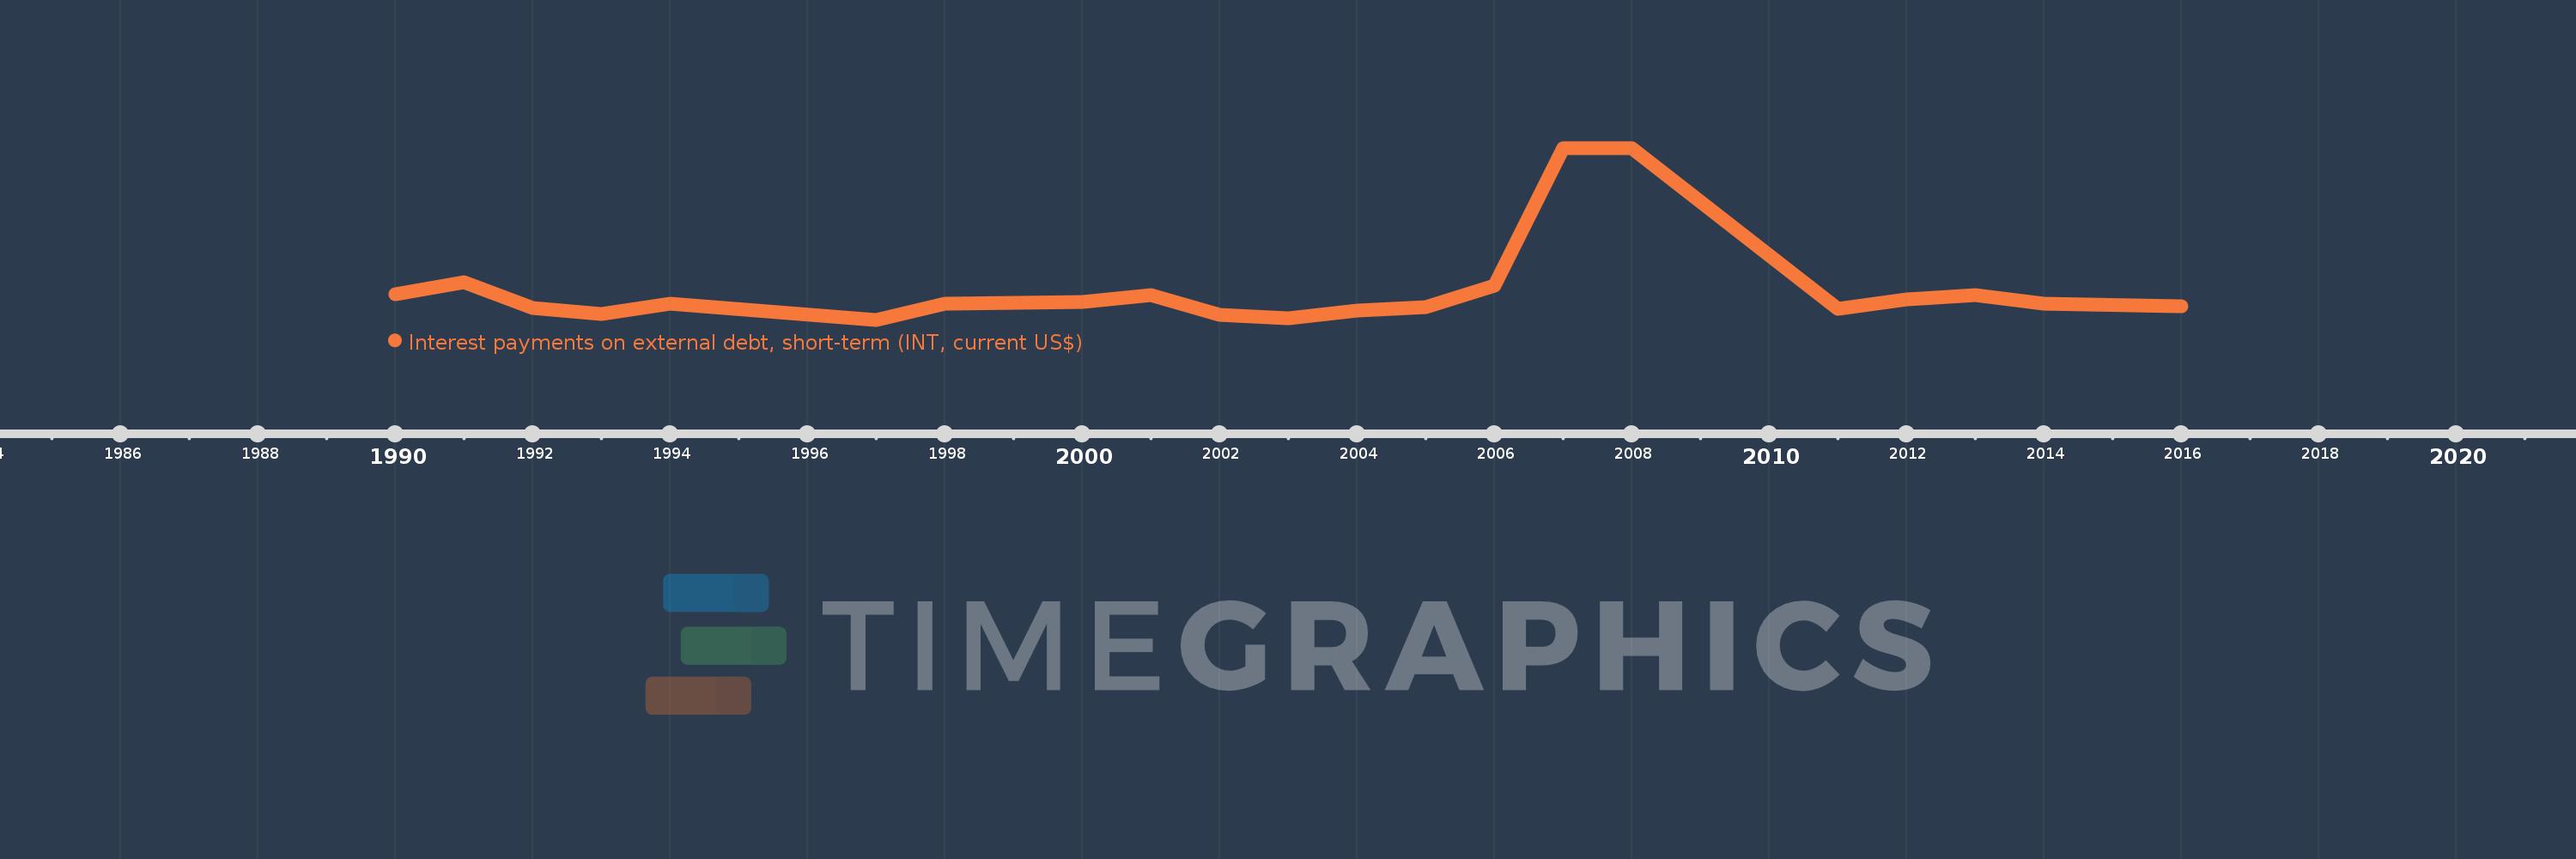
En esta escala de tiempo se presenta un gráfico de 1990 y 2016 de Bhutan. Los datos de 1989 están ausentes. El número de observaciones reales por fecha: 21.
Fuente (nombre):
Indicadores del desarrollo mundial
Fuente (organización):
World Bank, International Debt Statistics.
Categorías:
External Debt
Se ha actualizado:
23 abr 2017 año
Los indicadores de los cambios de valor en los últimos años
En promedio:
185.143 mil
Mínimo:
7.0 mil
1 ene 1997 año
Máximo:
1000.0 mil
1 ene 2007 año
A la fecha de observación
Valor
Cambio absoluto
El cambio con respecto al valor anterior
1 ene 1990 año
155.0 mil
+155.0 mil
0.0%
1 ene 1991 año
225.0 mil
+70.0 mil
45.16%
1 ene 1992 año
75.0 mil
-150.0 mil
-66.67%
1 ene 1993 año
40.0 mil
-35.0 mil
-46.67%
1 ene 1994 año
100.0 mil
+60.0 mil
150.0%
1 ene 1997 año
7.0 mil
-93.0 mil
-93.0%
1 ene 1998 año
100.0 mil
+93.0 mil
1.33 mil%
1 ene 2000 año
111.0 mil
+11.0 mil
11.0%
1 ene 2001 año
151.0 mil
+40.0 mil
36.04%
1 ene 2002 año
36.0 mil
-115.0 mil
-76.16%
1 ene 2003 año
15.0 mil
-21.0 mil
-58.33%
1 ene 2004 año
60.0 mil
+45.0 mil
300.0%
1 ene 2005 año
78.0 mil
+18.0 mil
30.0%
1 ene 2006 año
203.0 mil
+125.0 mil
160.26%
1 ene 2007 año
1000.0 mil
+797.0 mil
392.61%
1 ene 2008 año
1000.0 mil
0.0
0.0%
1 ene 2011 año
71.0 mil
-929.0 mil
-92.9%
1 ene 2012 año
126.0 mil
+55.0 mil
77.46%
1 ene 2013 año
150.0 mil
+24.0 mil
19.05%
1 ene 2014 año
100.0 mil
-50.0 mil
-33.33%
1 ene 2016 año
85.0 mil
-15.0 mil
-15.0%
Ranking de los países por los datos estadísticos actuales
