29
/es/
es
AIzaSyAYiBZKx7MnpbEhh9jyipgxe19OcubqV5w
April 1, 2024
85797
Bhutan
BTN
true
2
1
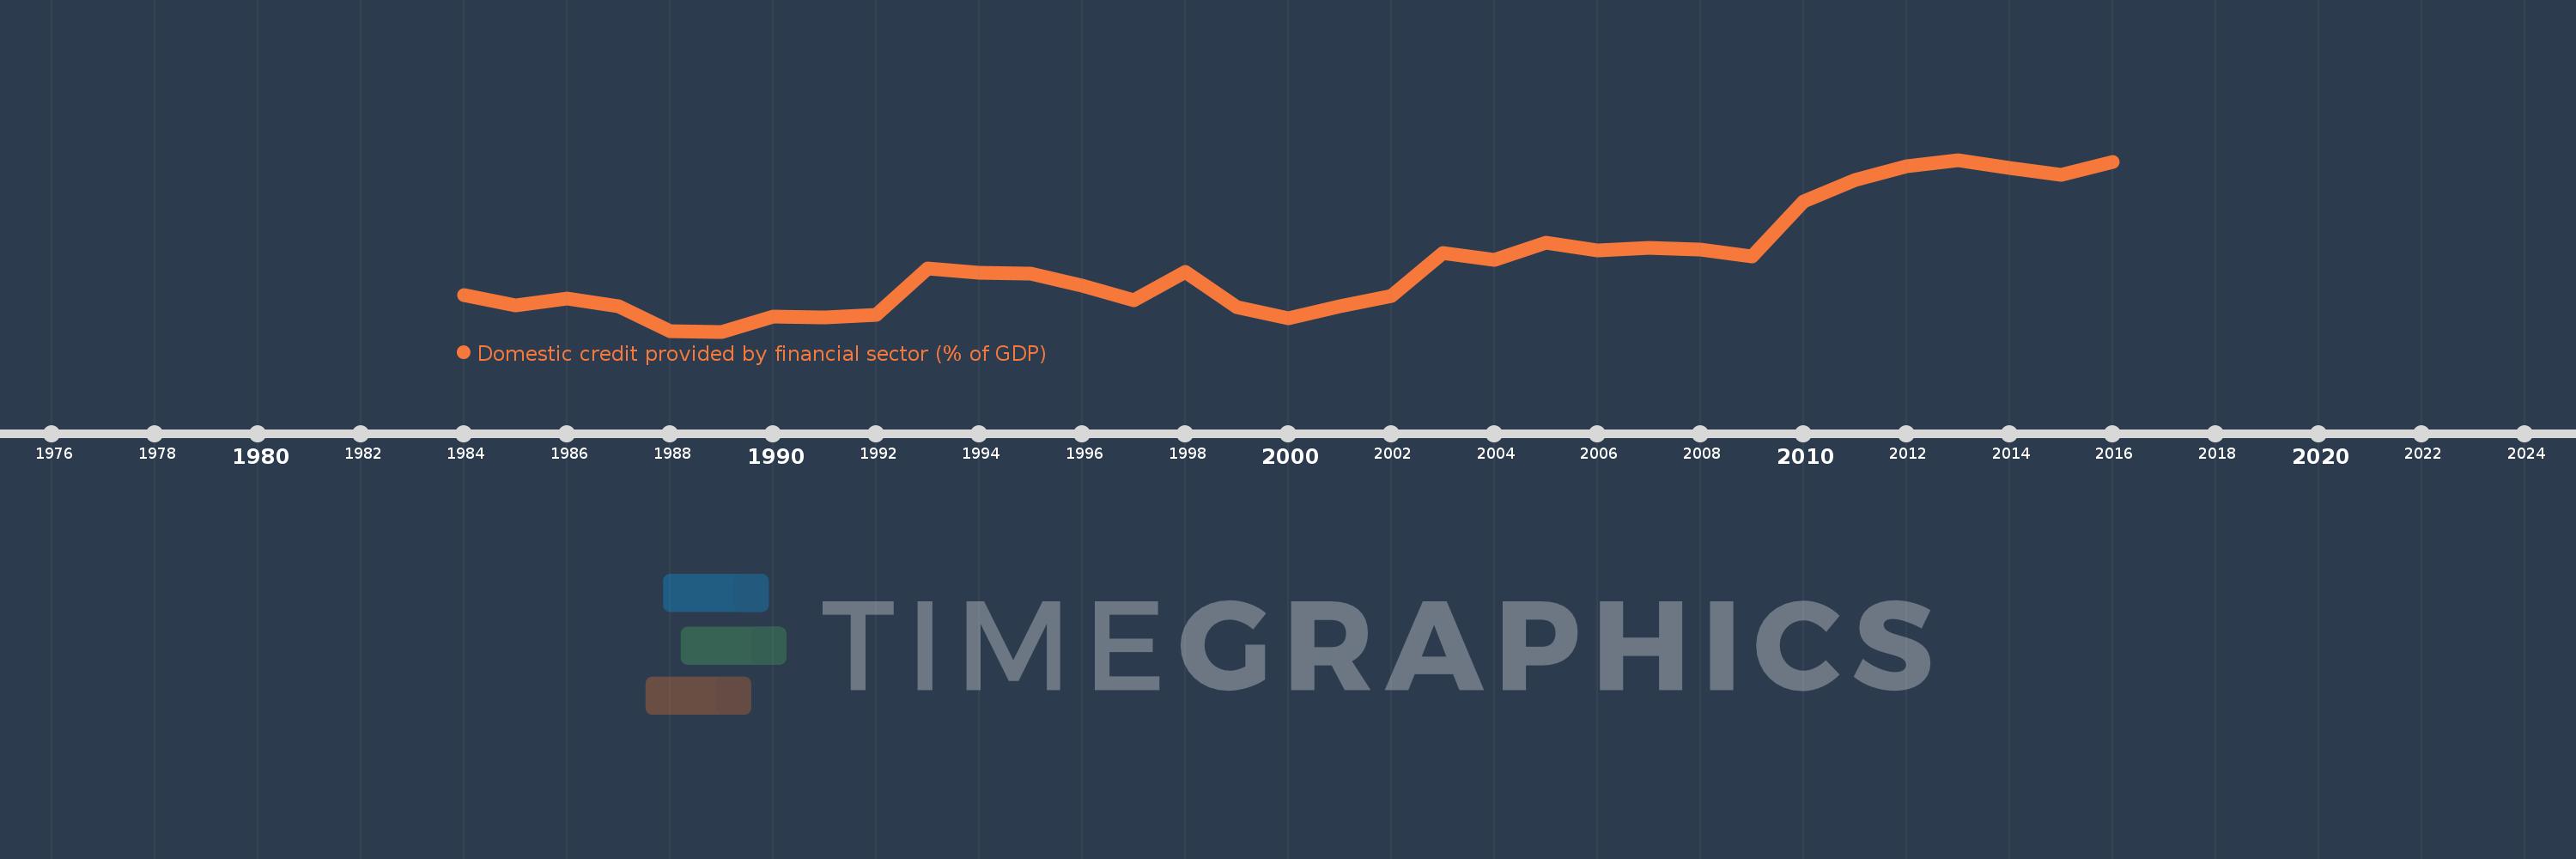
Domestic credit provided by financial sector (% of GDP)
2016,2015,2014,2013,2012,2011,2010,2009,2008,2007,2006,2005,2004,2003,2002,2001,2000,1999,1998,1997,1996,1995,1994,1993,1992,1991,1990,1989,1988,1987,1986,1985,1984
Estas estadísticas en otros países:
AfghanistanAlbaniaAlgeriaAngolaAntigua and BarbudaArab WorldArgentinaArmeniaArubaAustraliaAustriaAzerbaijanBahamas, TheBahrainBangladeshBarbadosBelarusBelgiumBelizeBeninBhutanBoliviaBosnia and HerzegovinaBotswanaBrazilBrunei DarussalamBulgariaBurkina FasoBurundiCabo VerdeCambodiaCameroonCanadaCaribbean small statesCentral African RepublicCentral Europe and the BalticsChadChileChinaColombiaComorosCongo, Dem. Rep.Congo, Rep.Costa RicaCote d'IvoireCroatiaCyprusCzech RepublicDenmarkDjiboutiDominicaDominican RepublicEarly-demographic dividendEast Asia & PacificEast Asia & Pacific (excluding high income)East Asia & Pacific (IDA & IBRD countries)EcuadorEgypt, Arab Rep.El SalvadorEquatorial GuineaEritreaEstoniaEthiopiaEuro areaEurope & Central AsiaEurope & Central Asia (excluding high income)Europe & Central Asia (IDA & IBRD countries)European UnionFijiFinlandFragile and conflict affected situationsFranceGabonGambia, TheGeorgiaGermanyGhanaGreeceGrenadaGuatemalaGuineaGuinea-BissauGuyanaHaitiHeavily indebted poor countries (HIPC)High incomeHondurasHong Kong SAR, ChinaHungaryIBRD onlyIcelandIDA & IBRD totalIDA blendIDA onlyIDA totalIndiaIndonesiaIran, Islamic Rep.IraqIrelandIsraelItalyJamaicaJapanJordanKazakhstanKenyaKorea, Rep.KosovoKuwaitKyrgyz RepublicLao PDRLate-demographic dividendLatin America & Caribbean Latin America & Caribbean (excluding high income)Latin America & the Caribbean (IDA & IBRD countries)LatviaLeast developed countries: UN classificationLebanonLesothoLiberiaLibyaLithuaniaLow & middle incomeLow incomeLower middle incomeLuxembourgMacao SAR, ChinaMacedonia, FYRMadagascarMalawiMalaysiaMaldivesMaliMaltaMauritaniaMauritiusMexicoMicronesia, Fed. Sts.Middle East & North AfricaMiddle East & North Africa (excluding high income)Middle East & North Africa (IDA & IBRD countries)Middle incomeMoldovaMongoliaMontenegroMoroccoMozambiqueMyanmarNamibiaNepalNetherlandsNew ZealandNicaraguaNigerNigeriaNorth AmericaNorwayOECD membersOmanOther small statesPacific island small statesPakistanPanamaPapua New GuineaParaguayPeruPhilippinesPolandPortugalPost-demographic dividendPre-demographic dividendQatarRomaniaRussian FederationRwandaSamoaSao Tome and PrincipeSaudi ArabiaSenegalSerbiaSeychellesSierra LeoneSingaporeSlovak RepublicSloveniaSmall statesSolomon IslandsSouth AfricaSouth AsiaSouth Asia (IDA & IBRD)South SudanSpainSri LankaSt. Kitts and NevisSt. LuciaSt. Vincent and the GrenadinesSub-Saharan Africa Sub-Saharan Africa (excluding high income)Sub-Saharan Africa (IDA & IBRD countries)SudanSurinameSwazilandSwedenSwitzerlandSyrian Arab RepublicTajikistanTanzaniaThailandTimor-LesteTogoTongaTrinidad and TobagoTunisiaTurkeyUgandaUkraineUnited Arab EmiratesUnited KingdomUnited StatesUpper middle incomeUruguayVanuatuVenezuela, RBVietnamWest Bank and GazaWorldYemen, Rep.ZambiaZimbabwe línea de tiempo (timeline):
En esta escala de tiempo se presenta un gráfico de 1984 y 2016 de Bhutan. Los datos de 1983 están ausentes. El número de observaciones reales por fecha: 33.
Fuente (nombre):
Indicadores del desarrollo mundial
Fuente (organización):
International Monetary Fund, International Financial Statistics and data files, and World Bank and OECD GDP estimates.
Categorías:
Financial Sector
Se ha actualizado:
23 abr 2017 año
Los indicadores de los cambios de valor en los últimos años
Mínimo:
-5.735
1 ene 1989 año
Máximo:
52.545
1 ene 2013 año
A la fecha de observación
Valor
Cambio absoluto
El cambio con respecto al valor anterior
1 ene 1984 año
6.601
+6.601
0.0%
1 ene 1985 año
3.074
-3.528
-53.44%
1 ene 1986 año
5.534
+2.461
80.06%
1 ene 1987 año
2.784
-2.75
-49.69%
1 ene 1988 año
-5.638
-8.422
-302.51%
1 ene 1989 año
-5.735
-0.097
1.72%
1 ene 1990 año
-0.604
+5.13
-89.46%
1 ene 1991 año
-1.023
-0.419
69.25%
1 ene 1992 año
-0.171
+0.852
-83.32%
1 ene 1993 año
15.715
+15.886
-9.31 mil%
1 ene 1994 año
14.273
-1.443
-9.18%
1 ene 1995 año
13.832
-0.441
-3.09%
1 ene 1996 año
9.862
-3.97
-28.7%
1 ene 1997 año
4.858
-5.004
-50.74%
1 ene 1998 año
14.608
+9.75
200.72%
1 ene 1999 año
2.599
-12.009
-82.21%
1 ene 2000 año
-1.305
-3.904
-150.22%
1 ene 2001 año
2.943
+4.248
-325.48%
1 ene 2002 año
6.37
+3.427
116.45%
1 ene 2003 año
20.825
+14.455
226.94%
1 ene 2004 año
18.511
-2.314
-11.11%
1 ene 2005 año
24.549
+6.038
32.62%
1 ene 2006 año
21.779
-2.77
-11.28%
1 ene 2007 año
22.688
+0.909
4.17%
1 ene 2008 año
22.146
-0.542
-2.39%
1 ene 2009 año
19.681
-2.465
-11.13%
1 ene 2010 año
38.384
+18.703
95.03%
1 ene 2011 año
45.572
+7.188
18.73%
1 ene 2012 año
50.475
+4.903
10.76%
1 ene 2013 año
52.545
+2.071
4.1%
1 ene 2014 año
49.75
-2.795
-5.32%
1 ene 2015 año
47.344
-2.406
-4.84%
1 ene 2016 año
51.813
+4.469
9.44%
Ranking de los países por los datos estadísticos actuales


Comentarios: