29
/es/
es
AIzaSyAYiBZKx7MnpbEhh9jyipgxe19OcubqV5w
April 1, 2024
78400
Bangladesh
BGD
true
2
1
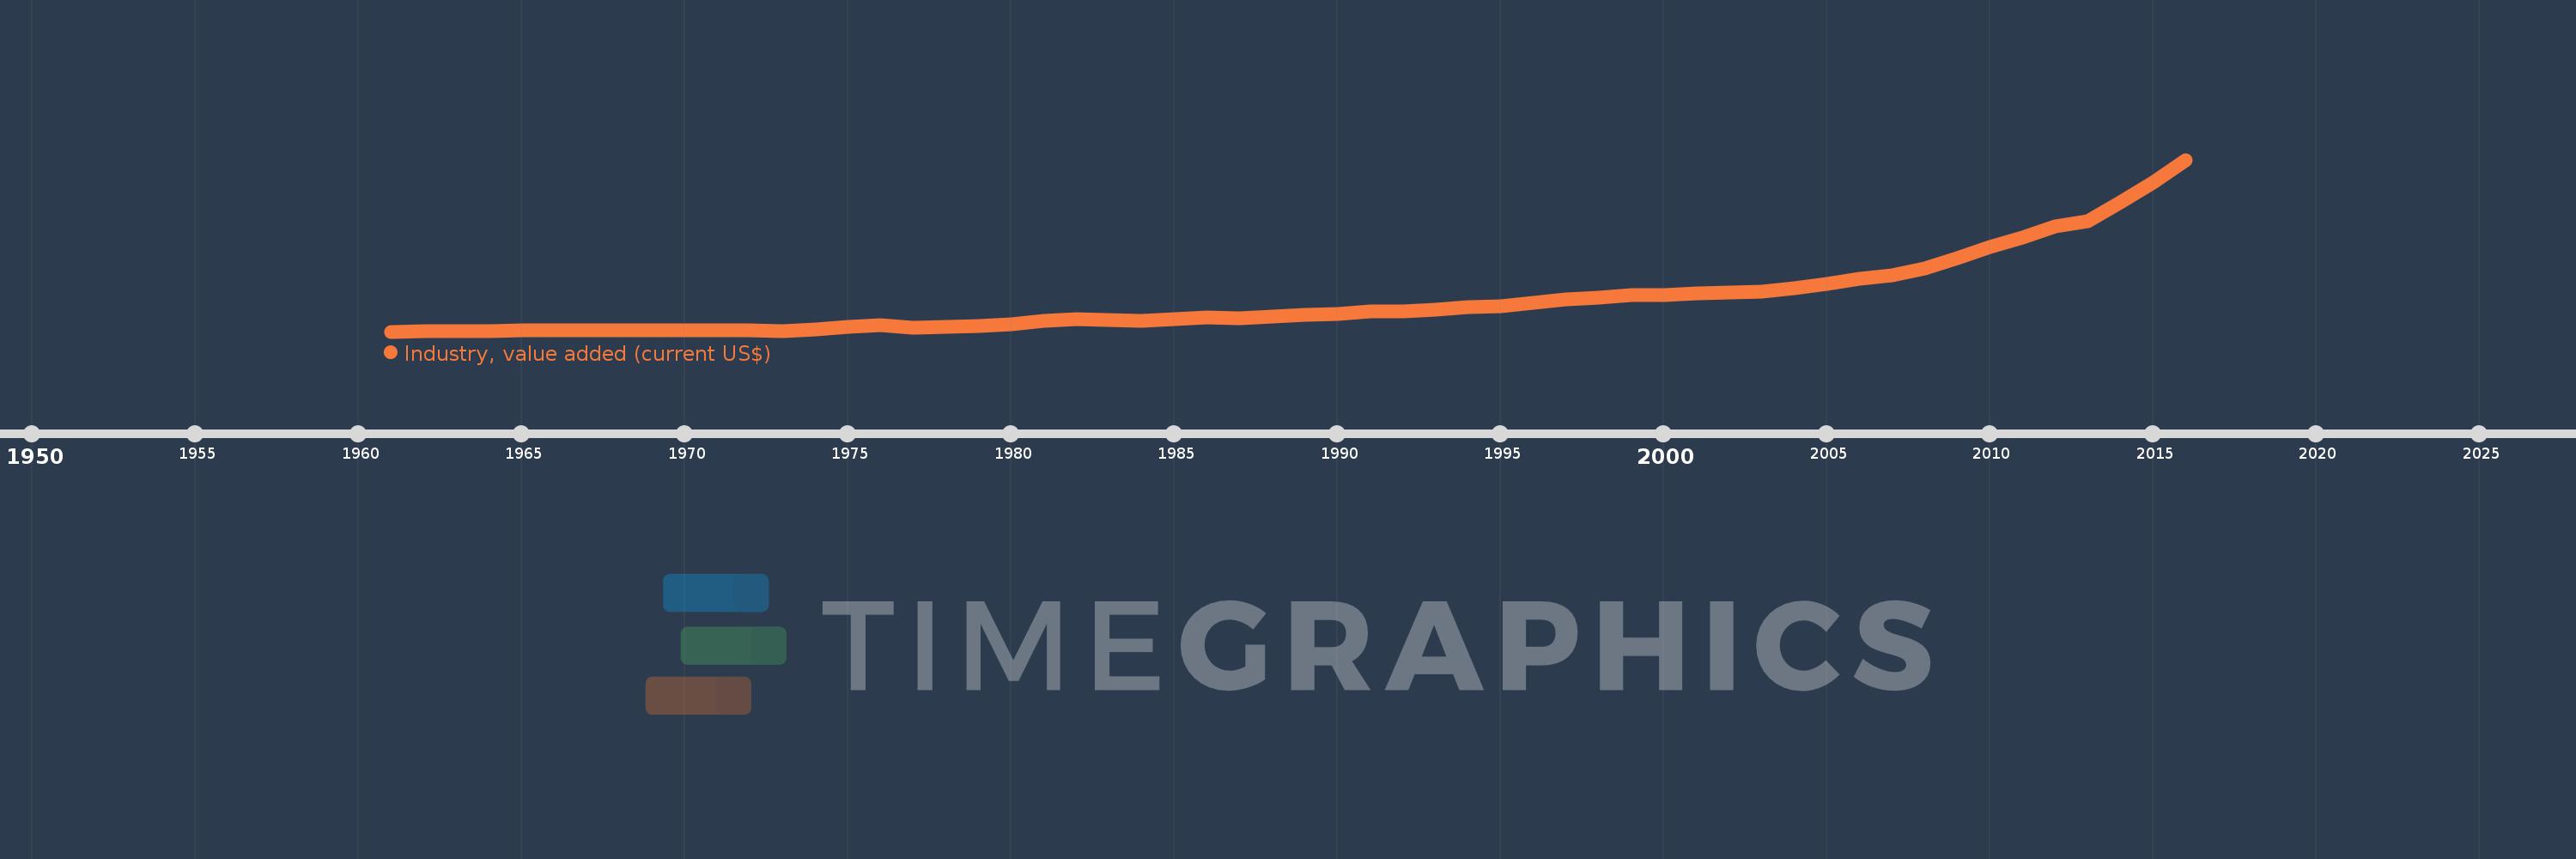
Industry, value added (current US$)
2016,2015,2014,2013,2012,2011,2010,2009,2008,2007,2006,2005,2004,2003,2002,2001,2000,1999,1998,1997,1996,1995,1994,1993,1992,1991,1990,1989,1988,1987,1986,1985,1984,1983,1982,1981,1980,1979,1978,1977,1976,1975,1974,1973,1972,1971,1970,1969,1968,1967,1966,1965,1964,1963,1962,1961
Estas estadísticas en otros países:
AfghanistanAlbaniaAlgeriaAndorraAngolaAntigua and BarbudaArab WorldArgentinaArmeniaArubaAustraliaAustriaAzerbaijanBahamas, TheBahrainBangladeshBarbadosBelarusBelgiumBelizeBeninBermudaBhutanBoliviaBosnia and HerzegovinaBotswanaBrazilBrunei DarussalamBulgariaBurkina FasoBurundiCabo VerdeCambodiaCameroonCanadaCaribbean small statesCayman IslandsCentral African RepublicCentral Europe and the BalticsChadChileChinaColombiaComorosCongo, Dem. Rep.Congo, Rep.Costa RicaCote d'IvoireCroatiaCubaCyprusCzech RepublicDenmarkDjiboutiDominicaDominican RepublicEarly-demographic dividendEast Asia & PacificEast Asia & Pacific (excluding high income)East Asia & Pacific (IDA & IBRD countries)EcuadorEgypt, Arab Rep.El SalvadorEquatorial GuineaEritreaEstoniaEthiopiaEuro areaEurope & Central AsiaEurope & Central Asia (excluding high income)Europe & Central Asia (IDA & IBRD countries)European UnionFijiFinlandFragile and conflict affected situationsFranceGabonGambia, TheGeorgiaGermanyGhanaGreeceGrenadaGuatemalaGuineaGuinea-BissauGuyanaHeavily indebted poor countries (HIPC)High incomeHondurasHong Kong SAR, ChinaHungaryIBRD onlyIcelandIDA & IBRD totalIDA blendIDA onlyIDA totalIndiaIndonesiaIran, Islamic Rep.IraqIrelandItalyJamaicaJapanJordanKazakhstanKenyaKiribatiKorea, Rep.KosovoKuwaitKyrgyz RepublicLao PDRLate-demographic dividendLatin America & Caribbean Latin America & Caribbean (excluding high income)Latin America & the Caribbean (IDA & IBRD countries)LatviaLeast developed countries: UN classificationLebanonLesothoLiberiaLibyaLiechtensteinLithuaniaLow & middle incomeLow incomeLower middle incomeLuxembourgMacao SAR, ChinaMacedonia, FYRMadagascarMalawiMalaysiaMaldivesMaliMaltaMarshall IslandsMauritaniaMauritiusMexicoMicronesia, Fed. Sts.Middle East & North AfricaMiddle East & North Africa (excluding high income)Middle East & North Africa (IDA & IBRD countries)Middle incomeMoldovaMongoliaMontenegroMoroccoMozambiqueMyanmarNamibiaNepalNetherlandsNew CaledoniaNew ZealandNicaraguaNigerNigeriaNorth AmericaNorwayOECD membersOmanOther small statesPacific island small statesPakistanPalauPanamaPapua New GuineaParaguayPeruPhilippinesPolandPortugalPost-demographic dividendPre-demographic dividendPuerto RicoQatarRomaniaRussian FederationRwandaSamoaSao Tome and PrincipeSaudi ArabiaSenegalSerbiaSeychellesSierra LeoneSingaporeSlovak RepublicSloveniaSmall statesSolomon IslandsSouth AfricaSouth AsiaSouth Asia (IDA & IBRD)SpainSri LankaSt. Kitts and NevisSt. LuciaSt. Vincent and the GrenadinesSub-Saharan Africa Sub-Saharan Africa (excluding high income)Sub-Saharan Africa (IDA & IBRD countries)SudanSurinameSwazilandSwedenSwitzerlandSyrian Arab RepublicTajikistanTanzaniaThailandTimor-LesteTogoTongaTrinidad and TobagoTunisiaTurkeyTurkmenistanTuvaluUgandaUkraineUnited Arab EmiratesUnited KingdomUnited StatesUpper middle incomeUruguayUzbekistanVanuatuVenezuela, RBVietnamWest Bank and GazaWorldYemen, Rep.ZambiaZimbabwe línea de tiempo (timeline):
En esta escala de tiempo se presenta un gráfico de 1961 y 2016 de Bangladesh. Los datos de 1960 están ausentes. El número de observaciones reales por fecha: 56.
Fuente (nombre):
Indicadores del desarrollo mundial
Fuente (organización):
World Bank national accounts data, and OECD National Accounts data files.
Categorías:
Economy & Growth
Se ha actualizado:
23 abr 2017 año
Los indicadores de los cambios de valor en los últimos años
Mínimo:
298.123 millones
1 ene 1961 año
Máximo:
52.342 bn
1 ene 2016 año
A la fecha de observación
Valor
Cambio absoluto
El cambio con respecto al valor anterior
1 ene 1961 año
298.123 millones
+298.123 millones
0.0%
1 ene 1962 año
327.312 millones
+29.189 millones
9.79%
1 ene 1963 año
404.677 millones
+77.365 millones
23.64%
1 ene 1964 año
415.162 millones
+10.485 millones
2.59%
1 ene 1965 año
561.39 millones
+146.228 millones
35.22%
1 ene 1966 año
633.37 millones
+71.98 millones
12.82%
1 ene 1967 año
664.259 millones
+30.889 millones
4.88%
1 ene 1968 año
587.745 millones
-76.515 millones
-11.52%
1 ene 1969 año
693.165 millones
+105.42 millones
17.94%
1 ene 1970 año
778.181 millones
+85.016 millones
12.26%
1 ene 1971 año
784.982 millones
+6.801 millones
0.87%
1 ene 1972 año
672.477 millones
-112.505 millones
-14.33%
1 ene 1973 año
381.326 millones
-291.152 millones
-43.3%
1 ene 1974 año
979.33 millones
+598.004 millones
156.82%
1 ene 1975 año
1.673 bn
+693.928 millones
70.86%
1 ene 1976 año
2.258 bn
+584.9 millones
34.96%
1 ene 1977 año
1.462 bn
-796.315 millones
-35.26%
1 ene 1978 año
1.615 bn
+152.706 millones
10.45%
1 ene 1979 año
1.901 bn
+286.035 millones
17.72%
1 ene 1980 año
2.442 bn
+541.089 millones
28.47%
1 ene 1981 año
3.649 bn
+1.207 bn
49.44%
1 ene 1982 año
4.011 bn
+361.876 millones
9.92%
1 ene 1983 año
3.713 bn
-297.625 millones
-7.42%
1 ene 1984 año
3.675 bn
-37.729 millones
-1.02%
1 ene 1985 año
4.055 bn
+379.545 millones
10.33%
1 ene 1986 año
4.527 bn
+472.506 millones
11.65%
1 ene 1987 año
4.437 bn
-90.013 millones
-1.99%
1 ene 1988 año
4.763 bn
+325.28 millones
7.33%
1 ene 1989 año
5.299 bn
+536.233 millones
11.26%
1 ene 1990 año
5.695 bn
+396.108 millones
7.48%
1 ene 1991 año
6.366 bn
+670.73 millones
11.78%
1 ene 1992 año
6.538 bn
+172.383 millones
2.71%
1 ene 1993 año
6.886 bn
+348.431 millones
5.33%
1 ene 1994 año
7.606 bn
+719.996 millones
10.46%
1 ene 1995 año
7.926 bn
+319.008 millones
4.19%
1 ene 1996 año
8.947 bn
+1.021 bn
12.88%
1 ene 1997 año
10.07 bn
+1.123 bn
12.55%
1 ene 1998 año
10.547 bn
+477.812 millones
4.75%
1 ene 1999 año
11.327 bn
+779.378 millones
7.39%
1 ene 2000 año
11.472 bn
+145.362 millones
1.28%
1 ene 2001 año
11.89 bn
+418.225 millones
3.65%
1 ene 2002 año
12.193 bn
+302.832 millones
2.55%
1 ene 2003 año
12.499 bn
+305.281 millones
2.5%
1 ene 2004 año
13.52 bn
+1.022 bn
8.17%
1 ene 2005 año
14.832 bn
+1.311 bn
9.7%
1 ene 2006 año
16.18 bn
+1.349 bn
9.09%
1 ene 2007 año
17.305 bn
+1.125 bn
6.95%
1 ene 2008 año
19.505 bn
+2.2 bn
12.71%
1 ene 2009 año
22.658 bn
+3.152 bn
16.16%
1 ene 2010 año
25.922 bn
+3.265 bn
14.41%
1 ene 2011 año
28.77 bn
+2.847 bn
10.98%
1 ene 2012 año
32.218 bn
+3.448 bn
11.99%
1 ene 2013 año
33.752 bn
+1.535 bn
4.76%
1 ene 2014 año
39.458 bn
+5.706 bn
16.9%
1 ene 2015 año
45.488 bn
+6.03 bn
15.28%
1 ene 2016 año
52.342 bn
+6.854 bn
15.07%
Ranking de los países por los datos estadísticos actuales


Comentarios: