30
/es/
AIzaSyAYiBZKx7MnpbEhh9jyipgxe19OcubqV5w
April 1, 2024
74271
Austria
AUT
true
2
1
Percentage of enrolment in secondary education in private institutions (%)
2015,2014,2013,2012,2011,2010,2009,2008,2007,2006,2005,2004,2003,2001,2000
Download
Estadísticas Globales de la Biblioteca →Austria →

Percentage of enrolment in secondary education in private institutions (%)

Estas estadísticas en otros países:

AfghanistanAlbaniaAlgeriaAndorraAngolaAntigua and BarbudaArab WorldArgentinaArmeniaArubaAustraliaAustriaAzerbaijanBahamas, TheBahrainBangladeshBarbadosBelarusBelgiumBelizeBeninBermudaBhutanBoliviaBosnia and HerzegovinaBotswanaBrazilBritish Virgin IslandsBrunei DarussalamBulgariaBurkina FasoBurundiCabo VerdeCambodiaCameroonCanadaCaribbean small statesCayman IslandsCentral African RepublicCentral Europe and the BalticsChadChileChinaColombiaComorosCongo, Dem. Rep.Congo, Rep.Costa RicaCote d'IvoireCroatiaCuracaoCyprusCzech RepublicDenmarkDjiboutiDominicaDominican RepublicEarly-demographic dividendEast Asia & PacificEast Asia & Pacific (excluding high income)East Asia & Pacific (IDA & IBRD countries)EcuadorEgypt, Arab Rep.El SalvadorEquatorial GuineaEritreaEstoniaEthiopiaEuro areaEurope & Central AsiaEurope & Central Asia (excluding high income)Europe & Central Asia (IDA & IBRD countries)European UnionFijiFinlandFragile and conflict affected situationsFranceGabonGeorgiaGermanyGhanaGibraltarGreeceGrenadaGuatemalaGuineaGuinea-BissauGuyanaHeavily indebted poor countries (HIPC)High incomeHondurasHong Kong SAR, ChinaHungaryIBRD onlyIcelandIDA & IBRD totalIDA blendIDA onlyIDA totalIndiaIndonesiaIran, Islamic Rep.IrelandIsraelItalyJamaicaJapanJordanKazakhstanKenyaKorea, Rep.KuwaitKyrgyz RepublicLao PDRLate-demographic dividendLatin America & Caribbean Latin America & Caribbean (excluding high income)Latin America & the Caribbean (IDA & IBRD countries)LatviaLeast developed countries: UN classificationLebanonLesothoLiberiaLibyaLiechtensteinLithuaniaLow & middle incomeLow incomeLower middle incomeLuxembourgMacao SAR, ChinaMacedonia, FYRMadagascarMalawiMalaysiaMaldivesMaliMaltaMarshall IslandsMauritaniaMauritiusMexicoMiddle East & North AfricaMiddle East & North Africa (excluding high income)Middle East & North Africa (IDA & IBRD countries)Middle incomeMoldovaMonacoMongoliaMontenegroMoroccoMozambiqueMyanmarNamibiaNauruNepalNetherlandsNew ZealandNicaraguaNigerNigeriaNorth AmericaNorwayOECD membersOmanOther small statesPacific island small statesPakistanPalauPanamaPapua New GuineaParaguayPeruPhilippinesPolandPortugalPost-demographic dividendPre-demographic dividendPuerto RicoQatarRomaniaRussian FederationRwandaSamoaSao Tome and PrincipeSaudi ArabiaSenegalSerbiaSeychellesSierra LeoneSingaporeSint Maarten (Dutch part)Slovak RepublicSloveniaSmall statesSolomon IslandsSouth AfricaSouth AsiaSouth Asia (IDA & IBRD)SpainSri LankaSt. Kitts and NevisSt. LuciaSt. Vincent and the GrenadinesSub-Saharan Africa Sub-Saharan Africa (excluding high income)Sub-Saharan Africa (IDA & IBRD countries)SudanSurinameSwazilandSwedenSwitzerlandSyrian Arab RepublicTajikistanTanzaniaThailandTimor-LesteTogoTongaTunisiaTurkeyTurks and Caicos IslandsTuvaluUgandaUkraineUnited Arab EmiratesUnited KingdomUnited StatesUpper middle incomeUruguayVanuatuVenezuela, RBWest Bank and GazaWorldYemen, Rep.Zimbabwe

línea de tiempo (timeline):

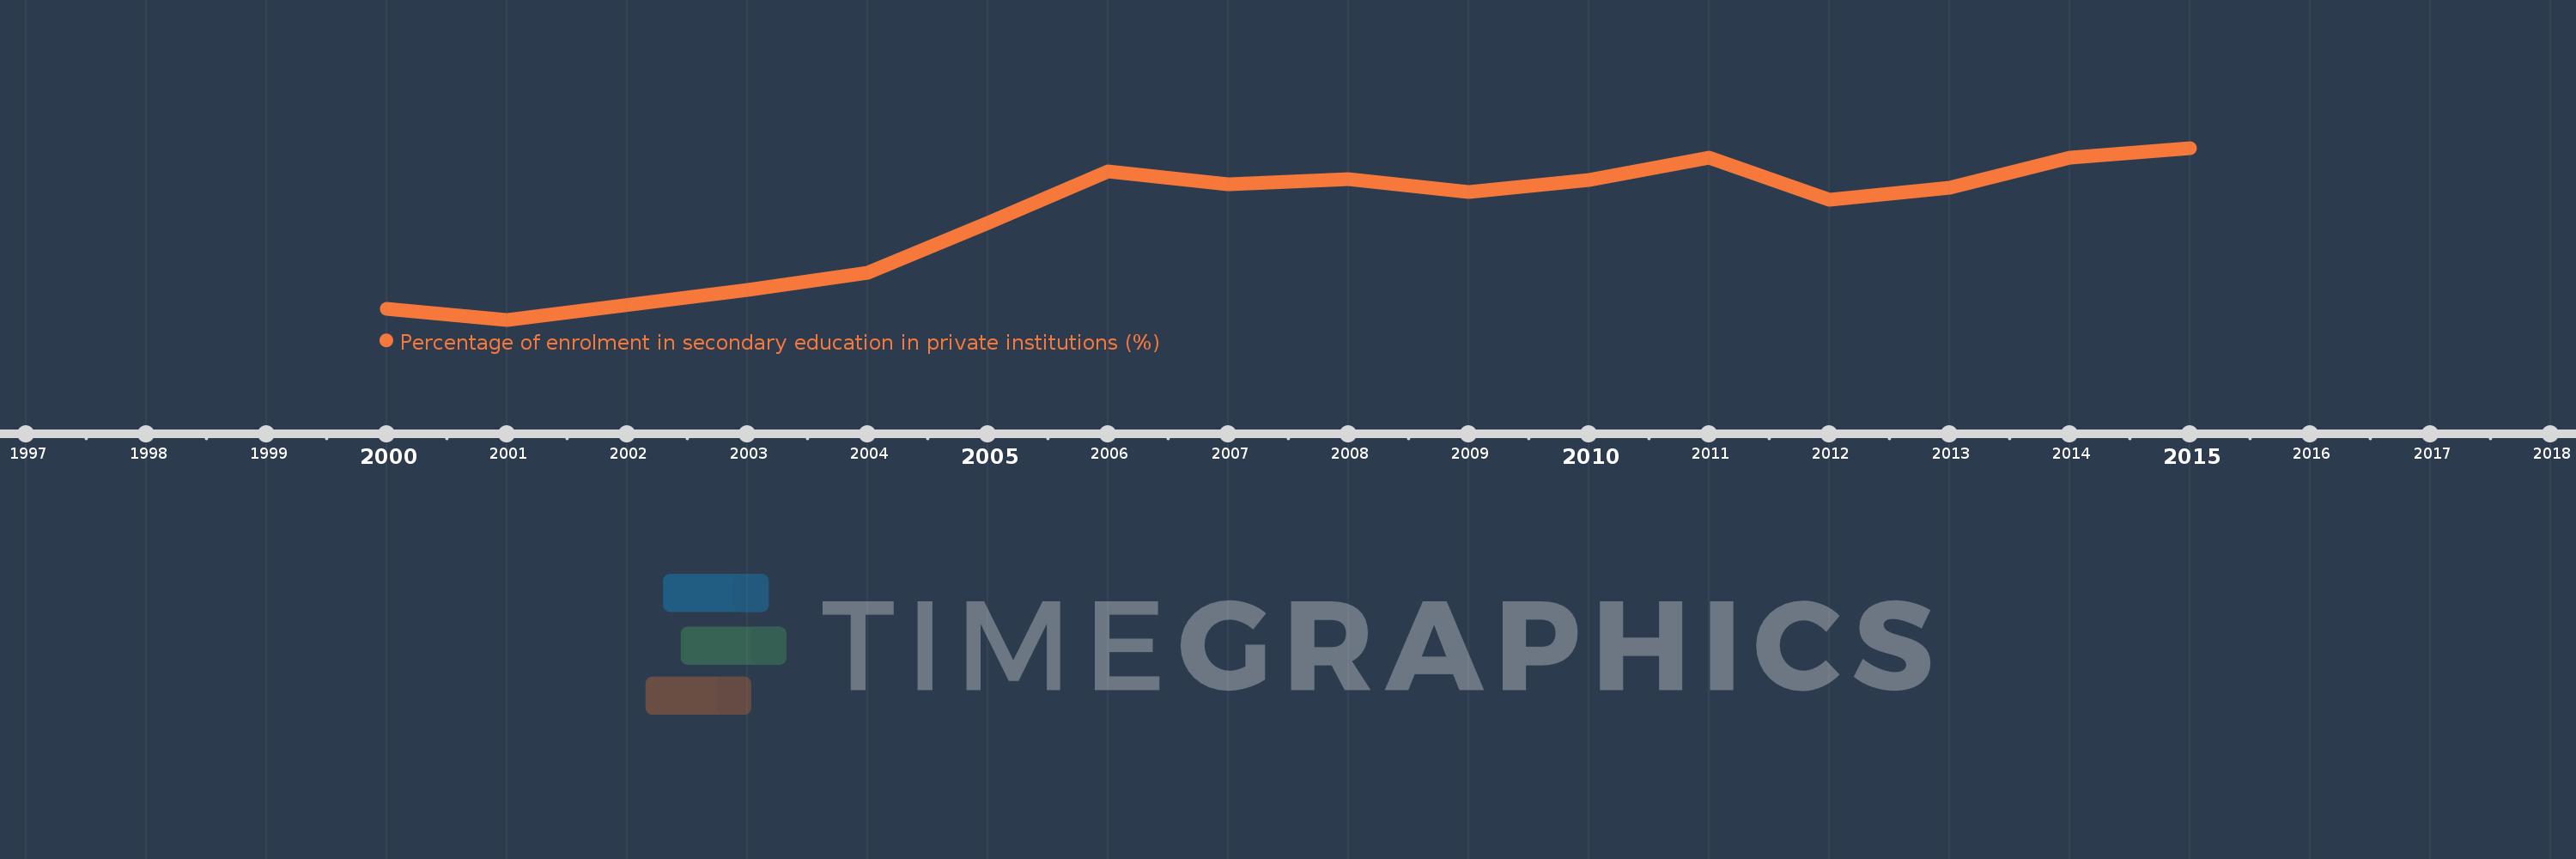
En esta escala de tiempo se presenta un gráfico de 2000 y 2015 de Austria. Los datos de 1999 están ausentes. El número de observaciones reales por fecha: 15.

Fuente (nombre):

Indicadores del desarrollo mundial

Fuente (organización):

UNESCO Institute for Statistics

Categorías:

Education

Se ha actualizado:

23 abr 2017 año

Los indicadores de los cambios de valor en los últimos años

En promedio:
9.377
Mínimo:
8.373
1 ene 2001 año
Máximo:
9.964
1 ene 2015 año
A la fecha de observación
Valor
Cambio absoluto
El cambio con respecto al valor anterior
1 ene 2000 año
8.477
+8.477
0.0%
1 ene 2001 año
8.373
-0.104
-1.22%
1 ene 2003 año
8.652
+0.279
3.33%
1 ene 2004 año
8.81
+0.158
1.83%
1 ene 2005 año
9.266
+0.456
5.18%
1 ene 2006 año
9.746
+0.479
5.17%
1 ene 2007 año
9.624
-0.122
-1.25%
1 ene 2008 año
9.679
+0.055
0.57%
1 ene 2009 año
9.557
-0.122
-1.26%
1 ene 2010 año
9.669
+0.112
1.17%
1 ene 2011 año
9.877
+0.208
2.15%
1 ene 2012 año
9.488
-0.388
-3.93%
1 ene 2013 año
9.598
+0.109
1.15%
1 ene 2014 año
9.872
+0.274
2.86%
1 ene 2015 año
9.964
+0.092
0.94%

Ranking de los países por los datos estadísticos actuales