29
/es/
es
AIzaSyAYiBZKx7MnpbEhh9jyipgxe19OcubqV5w
April 1, 2024
73071
Australia
AUS
true
2
1
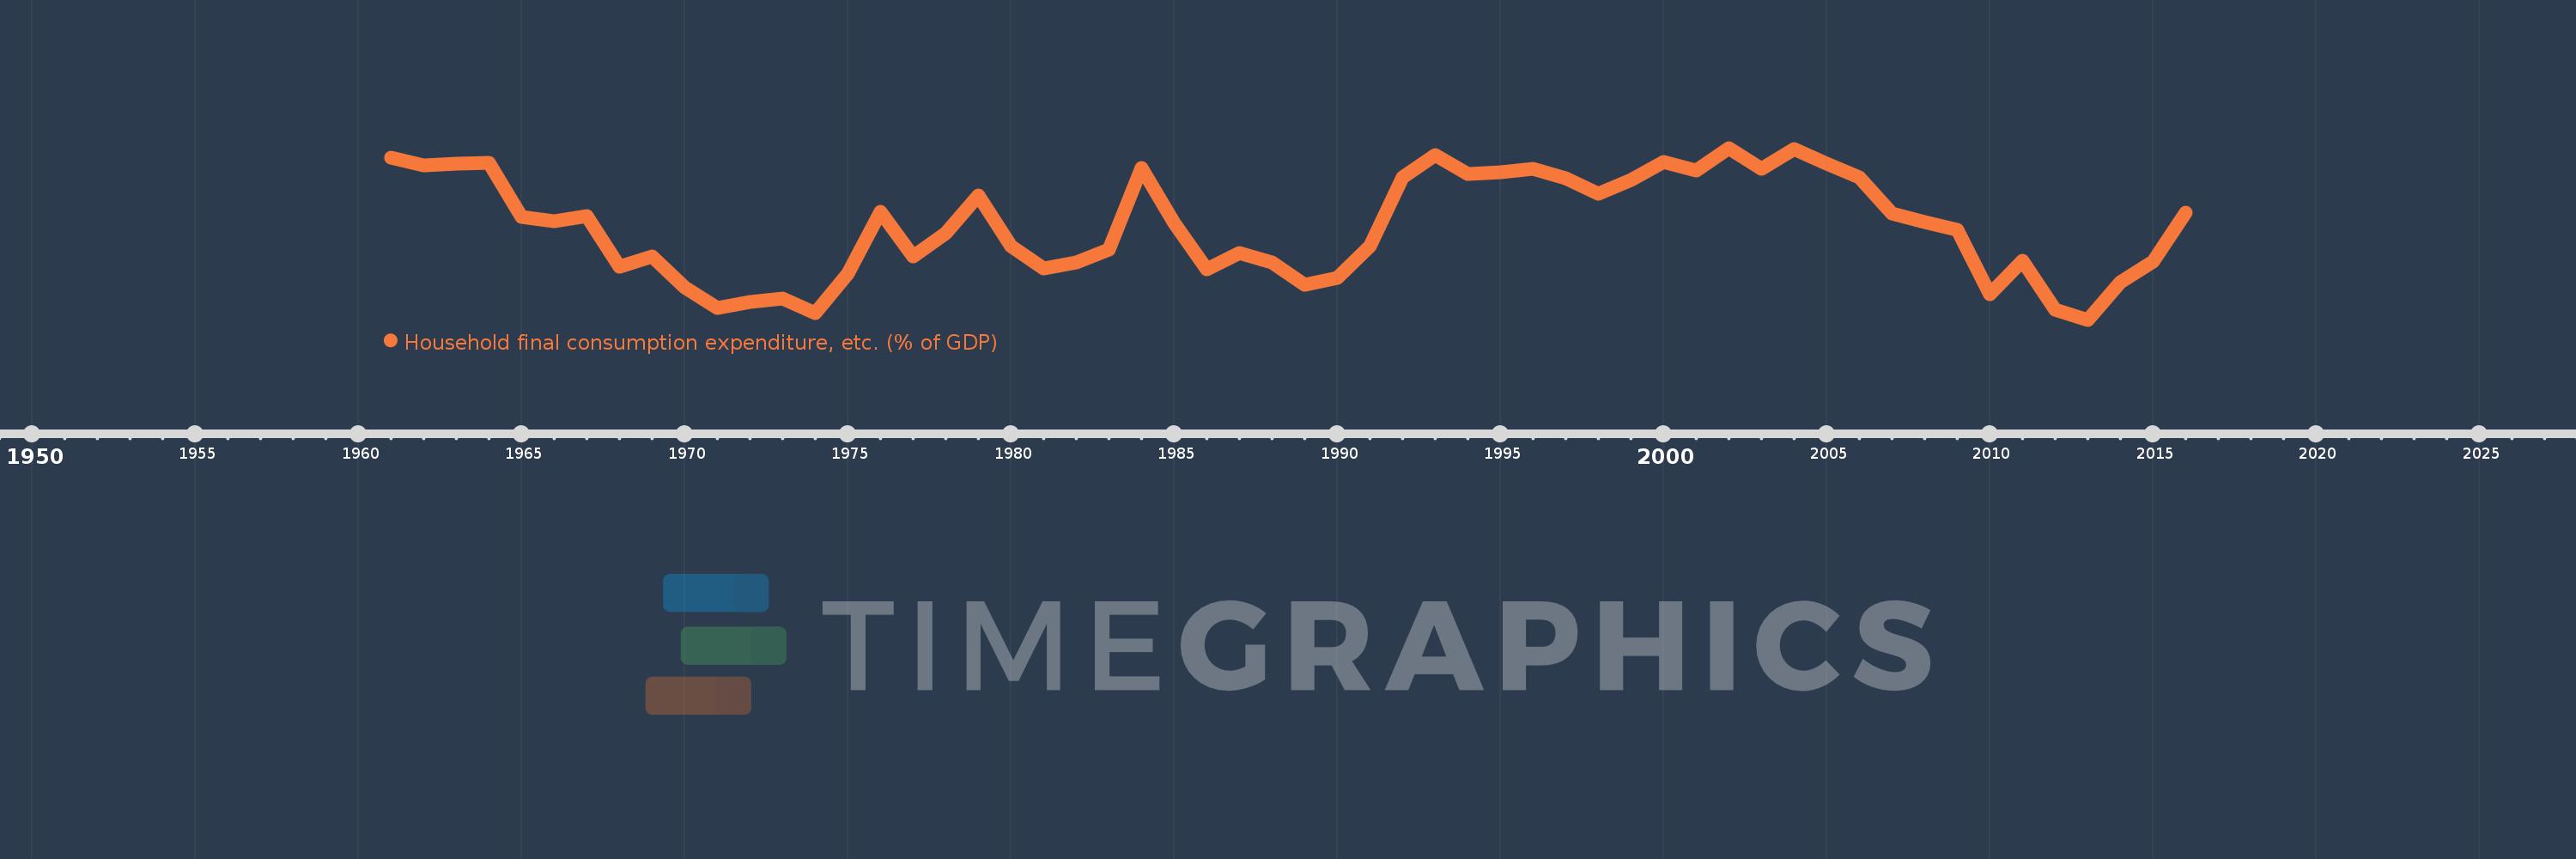
Household final consumption expenditure, etc. (% of GDP)
2016,2015,2014,2013,2012,2011,2010,2009,2008,2007,2006,2005,2004,2003,2002,2001,2000,1999,1998,1997,1996,1995,1994,1993,1992,1991,1990,1989,1988,1987,1986,1985,1984,1983,1982,1981,1980,1979,1978,1977,1976,1975,1974,1973,1972,1971,1970,1969,1968,1967,1966,1965,1964,1963,1962,1961
Estas estadísticas en otros países:
AfghanistanAlbaniaAlgeriaAngolaAntigua and BarbudaArab WorldArgentinaArmeniaArubaAustraliaAustriaAzerbaijanBahamas, TheBahrainBangladeshBarbadosBelarusBelgiumBelizeBeninBermudaBhutanBoliviaBosnia and HerzegovinaBotswanaBrazilBrunei DarussalamBulgariaBurkina FasoBurundiCabo VerdeCambodiaCameroonCanadaCaribbean small statesCentral African RepublicCentral Europe and the BalticsChadChileChinaColombiaComorosCongo, Dem. Rep.Congo, Rep.Costa RicaCote d'IvoireCroatiaCubaCyprusCzech RepublicDenmarkDjiboutiDominicaDominican RepublicEarly-demographic dividendEast Asia & PacificEast Asia & Pacific (excluding high income)East Asia & Pacific (IDA & IBRD countries)EcuadorEgypt, Arab Rep.El SalvadorEquatorial GuineaEritreaEstoniaEthiopiaEuro areaEurope & Central AsiaEurope & Central Asia (excluding high income)Europe & Central Asia (IDA & IBRD countries)European UnionFaroe IslandsFijiFinlandFragile and conflict affected situationsFranceGabonGambia, TheGeorgiaGermanyGhanaGreeceGrenadaGuatemalaGuineaGuinea-BissauGuyanaHaitiHeavily indebted poor countries (HIPC)High incomeHondurasHong Kong SAR, ChinaHungaryIBRD onlyIcelandIDA & IBRD totalIDA blendIDA onlyIDA totalIndiaIndonesiaIran, Islamic Rep.IraqIrelandIsraelItalyJamaicaJapanJordanKazakhstanKenyaKiribatiKorea, Rep.KosovoKuwaitKyrgyz RepublicLao PDRLate-demographic dividendLatin America & Caribbean Latin America & Caribbean (excluding high income)Latin America & the Caribbean (IDA & IBRD countries)LatviaLeast developed countries: UN classificationLebanonLesothoLiberiaLibyaLithuaniaLow & middle incomeLow incomeLower middle incomeLuxembourgMacao SAR, ChinaMacedonia, FYRMadagascarMalawiMalaysiaMaldivesMaliMaltaMauritaniaMauritiusMexicoMicronesia, Fed. Sts.Middle East & North AfricaMiddle East & North Africa (excluding high income)Middle East & North Africa (IDA & IBRD countries)Middle incomeMoldovaMongoliaMontenegroMoroccoMozambiqueNamibiaNepalNetherlandsNew CaledoniaNew ZealandNicaraguaNigerNigeriaNorth AmericaNorwayOECD membersOmanOther small statesPacific island small statesPakistanPanamaPapua New GuineaParaguayPeruPhilippinesPolandPortugalPost-demographic dividendPre-demographic dividendPuerto RicoQatarRomaniaRussian FederationRwandaSaudi ArabiaSenegalSerbiaSeychellesSierra LeoneSingaporeSlovak RepublicSloveniaSmall statesSolomon IslandsSomaliaSouth AfricaSouth AsiaSouth Asia (IDA & IBRD)South SudanSpainSri LankaSt. Kitts and NevisSt. LuciaSt. Vincent and the GrenadinesSub-Saharan Africa Sub-Saharan Africa (excluding high income)Sub-Saharan Africa (IDA & IBRD countries)SudanSurinameSwazilandSwedenSwitzerlandSyrian Arab RepublicTajikistanTanzaniaThailandTimor-LesteTogoTongaTrinidad and TobagoTunisiaTurkeyTurkmenistanUgandaUkraineUnited Arab EmiratesUnited KingdomUnited StatesUpper middle incomeUruguayUzbekistanVanuatuVenezuela, RBVietnamWest Bank and GazaWorldYemen, Rep.ZambiaZimbabwe línea de tiempo (timeline):
En esta escala de tiempo se presenta un gráfico de 1961 y 2016 de Australia. Los datos de 1960 están ausentes. El número de observaciones reales por fecha: 56.
Fuente (nombre):
Indicadores del desarrollo mundial
Fuente (organización):
World Bank national accounts data, and OECD National Accounts data files.
Categorías:
Economy & Growth
Se ha actualizado:
23 abr 2017 año
Los indicadores de los cambios de valor en los últimos años
Mínimo:
53.733
1 ene 2013 año
Máximo:
58.734
1 ene 2002 año
A la fecha de observación
Valor
Cambio absoluto
El cambio con respecto al valor anterior
1 ene 1961 año
58.453
+58.453
0.0%
1 ene 1962 año
58.223
-0.23
-0.39%
1 ene 1963 año
58.274
+0.051
0.09%
1 ene 1964 año
58.307
+0.033
0.06%
1 ene 1965 año
56.737
-1.569
-2.69%
1 ene 1966 año
56.594
-0.143
-0.25%
1 ene 1967 año
56.752
+0.158
0.28%
1 ene 1968 año
55.285
-1.468
-2.59%
1 ene 1969 año
55.575
+0.291
0.53%
1 ene 1970 año
54.669
-0.907
-1.63%
1 ene 1971 año
54.076
-0.593
-1.08%
1 ene 1972 año
54.251
+0.175
0.32%
1 ene 1973 año
54.352
+0.101
0.19%
1 ene 1974 año
53.922
-0.43
-0.79%
1 ene 1975 año
55.08
+1.158
2.15%
1 ene 1976 año
56.883
+1.803
3.27%
1 ene 1977 año
55.587
-1.296
-2.28%
1 ene 1978 año
56.245
+0.658
1.18%
1 ene 1979 año
57.361
+1.115
1.98%
1 ene 1980 año
55.885
-1.476
-2.57%
1 ene 1981 año
55.23
-0.655
-1.17%
1 ene 1982 año
55.41
+0.18
0.33%
1 ene 1983 año
55.776
+0.366
0.66%
1 ene 1984 año
58.149
+2.373
4.26%
1 ene 1985 año
56.558
-1.592
-2.74%
1 ene 1986 año
55.208
-1.35
-2.39%
1 ene 1987 año
55.666
+0.458
0.83%
1 ene 1988 año
55.389
-0.277
-0.5%
1 ene 1989 año
54.739
-0.65
-1.17%
1 ene 1990 año
54.956
+0.217
0.4%
1 ene 1991 año
55.879
+0.924
1.68%
1 ene 1992 año
57.874
+1.994
3.57%
1 ene 1993 año
58.526
+0.653
1.13%
1 ene 1994 año
57.968
-0.558
-0.95%
1 ene 1995 año
58.034
+0.066
0.11%
1 ene 1996 año
58.131
+0.097
0.17%
1 ene 1997 año
57.84
-0.291
-0.5%
1 ene 1998 año
57.399
-0.441
-0.76%
1 ene 1999 año
57.81
+0.411
0.72%
1 ene 2000 año
58.325
+0.515
0.89%
1 ene 2001 año
58.07
-0.255
-0.44%
1 ene 2002 año
58.734
+0.664
1.14%
1 ene 2003 año
58.116
-0.618
-1.05%
1 ene 2004 año
58.693
+0.577
0.99%
1 ene 2005 año
58.286
-0.407
-0.69%
1 ene 2006 año
57.868
-0.419
-0.72%
1 ene 2007 año
56.836
-1.032
-1.78%
1 ene 2008 año
56.566
-0.27
-0.48%
1 ene 2009 año
56.356
-0.209
-0.37%
1 ene 2010 año
54.478
-1.879
-3.33%
1 ene 2011 año
55.444
+0.967
1.77%
1 ene 2012 año
54.025
-1.42
-2.56%
1 ene 2013 año
53.733
-0.292
-0.54%
1 ene 2014 año
54.831
+1.097
2.04%
1 ene 2015 año
55.427
+0.597
1.09%
1 ene 2016 año
56.863
+1.435
2.59%
Ranking de los países por los datos estadísticos actuales


Comentarios: