29
/es/
es
AIzaSyAYiBZKx7MnpbEhh9jyipgxe19OcubqV5w
April 1, 2024
70164
Argentina
ARG
true
2
1
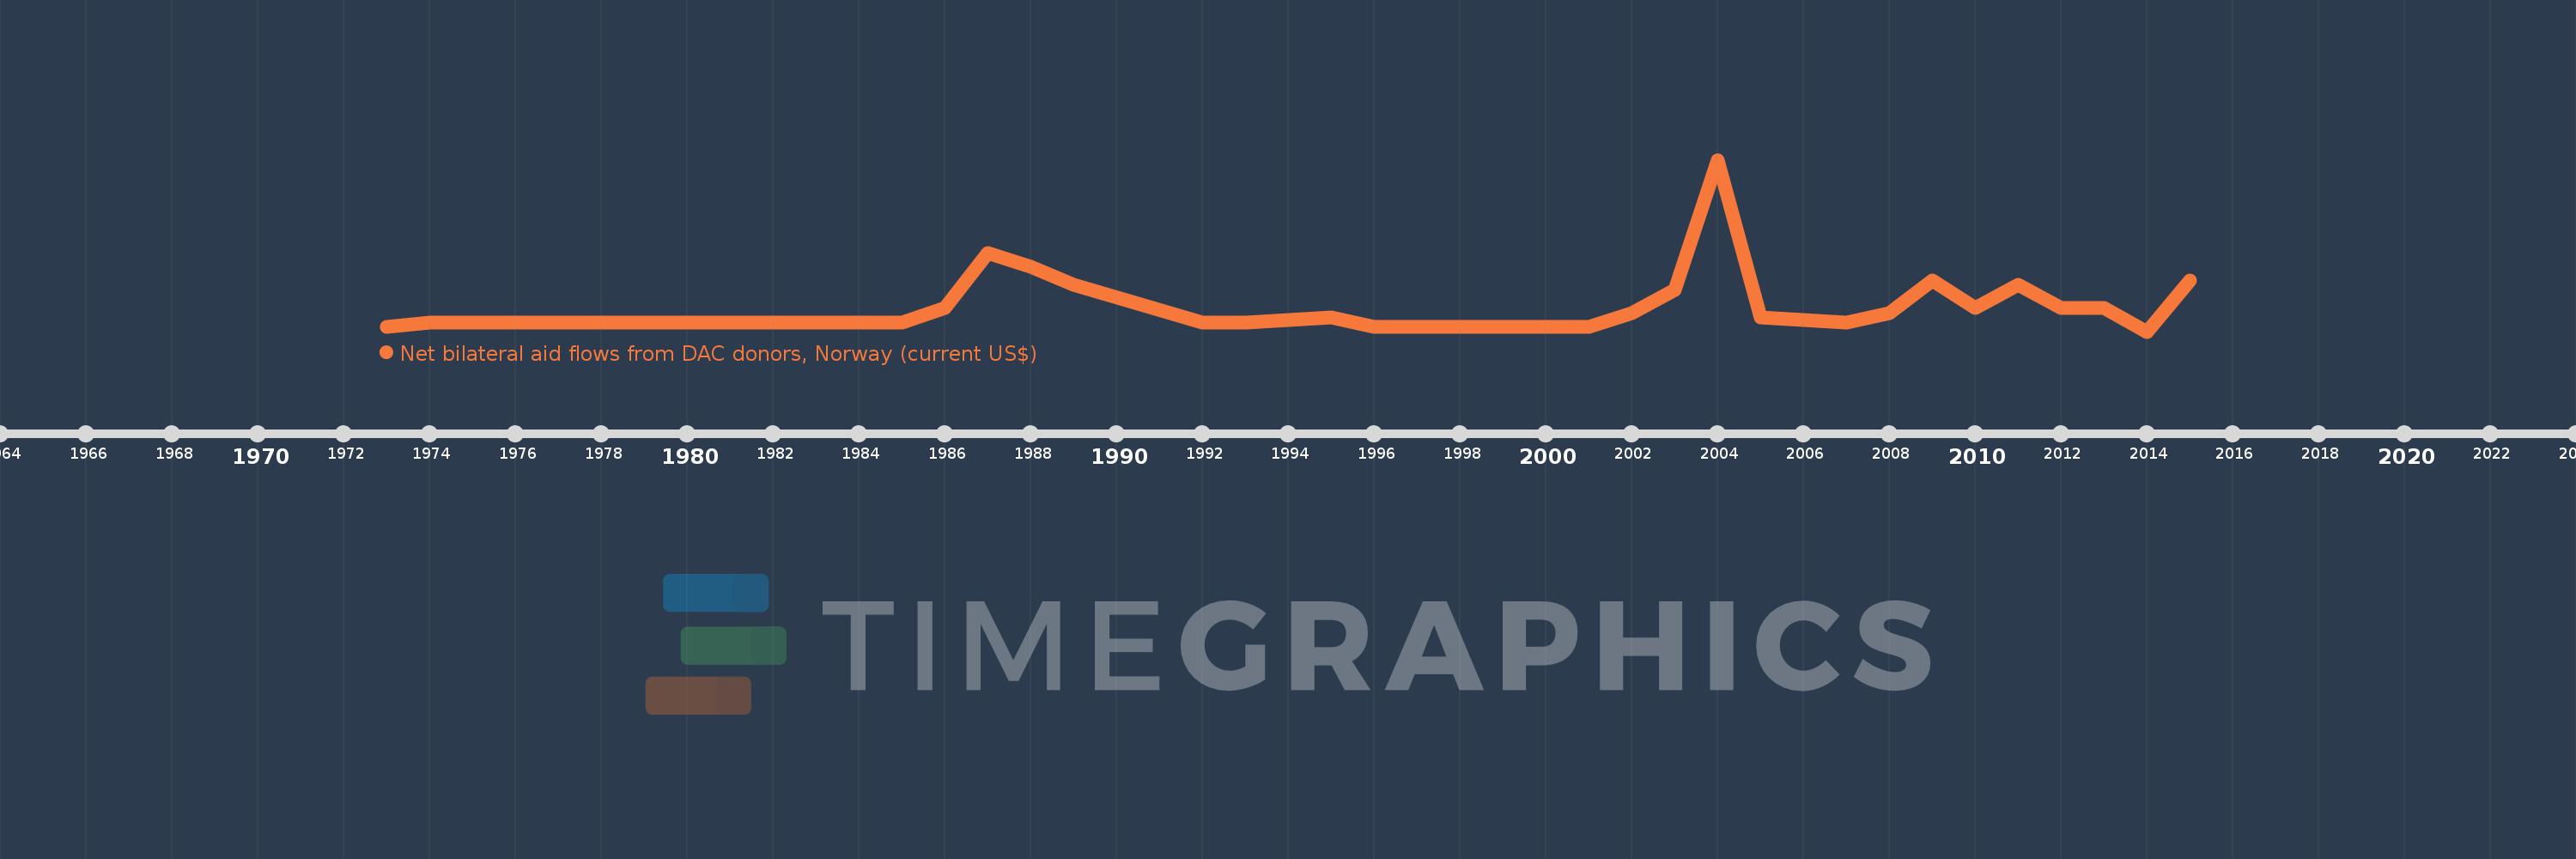
Net bilateral aid flows from DAC donors, Norway (current US$)
2015,2014,2013,2012,2011,2010,2009,2008,2007,2005,2004,2003,2002,2001,2000,1997,1996,1995,1993,1992,1989,1988,1987,1986,1985,1981,1976,1975,1974,1973
Estas estadísticas en otros países:
AfghanistanAlbaniaAlgeriaAngolaAntigua and BarbudaArab WorldArgentinaArmeniaAzerbaijanBahrainBangladeshBarbadosBelarusBelizeBeninBermudaBhutanBoliviaBosnia and HerzegovinaBotswanaBrazilBulgariaBurkina FasoBurundiCabo VerdeCambodiaCameroonCaribbean small statesCentral African RepublicCentral Europe and the BalticsChadChileChinaColombiaComorosCongo, Dem. Rep.Congo, Rep.Costa RicaCote d'IvoireCroatiaCubaCyprusCzech RepublicDjiboutiDominican RepublicEast Asia & PacificEast Asia & Pacific (excluding high income)East Asia & Pacific (IDA & IBRD countries)EcuadorEgypt, Arab Rep.El SalvadorEquatorial GuineaEritreaEstoniaEthiopiaEuro areaEurope & Central AsiaEurope & Central Asia (excluding high income)Europe & Central Asia (IDA & IBRD countries)European UnionFijiFragile and conflict affected situationsGabonGambia, TheGeorgiaGhanaGibraltarGrenadaGuatemalaGuineaGuinea-BissauGuyanaHaitiHeavily indebted poor countries (HIPC)High incomeHondurasHong Kong SAR, ChinaHungaryIBRD onlyIDA & IBRD totalIDA blendIDA onlyIDA totalIndiaIndonesiaIran, Islamic Rep.IraqIsraelJamaicaJordanKazakhstanKenyaKiribatiKorea, Dem. People’s Rep.Korea, Rep.KosovoKuwaitKyrgyz RepublicLao PDRLatin America & Caribbean Latin America & Caribbean (excluding high income)Latin America & the Caribbean (IDA & IBRD countries)LatviaLeast developed countries: UN classificationLebanonLesothoLiberiaLibyaLithuaniaLow & middle incomeLow incomeLower middle incomeMacao SAR, ChinaMacedonia, FYRMadagascarMalawiMalaysiaMaldivesMaliMaltaMarshall IslandsMauritaniaMauritiusMexicoMiddle East & North AfricaMiddle East & North Africa (excluding high income)Middle East & North Africa (IDA & IBRD countries)Middle incomeMoldovaMongoliaMontenegroMoroccoMozambiqueMyanmarNamibiaNauruNepalNicaraguaNigerNigeriaNorth AmericaOECD membersOmanOther small statesPacific island small statesPakistanPanamaPapua New GuineaParaguayPeruPhilippinesPolandRomaniaRussian FederationRwandaSamoaSao Tome and PrincipeSaudi ArabiaSenegalSerbiaSeychellesSierra LeoneSingaporeSlovak RepublicSloveniaSmall statesSolomon IslandsSomaliaSouth AfricaSouth AsiaSouth Asia (IDA & IBRD)South SudanSri LankaSt. Kitts and NevisSt. LuciaSt. Vincent and the GrenadinesSub-Saharan Africa Sub-Saharan Africa (excluding high income)Sub-Saharan Africa (IDA & IBRD countries)SudanSurinameSwazilandSyrian Arab RepublicTajikistanTanzaniaThailandTimor-LesteTogoTongaTrinidad and TobagoTunisiaTurkeyTurkmenistanUgandaUkraineUnited Arab EmiratesUpper middle incomeUruguayUzbekistanVanuatuVenezuela, RBVietnamWest Bank and GazaWorldYemen, Rep.ZambiaZimbabwe línea de tiempo (timeline):
En esta escala de tiempo se presenta un gráfico de 1973 y 2015 de Argentina. Los datos de 1972 están ausentes. El número de observaciones reales por fecha: 30.
Fuente (nombre):
Indicadores del desarrollo mundial
Fuente (organización):
Development Assistance Committee of the Organisation for Economic Co-operation and Development, Geographical Distribution of Financial Flows to Developing Countries, Development Co-operation Report, and International Development Statistics database. Data are available online at: www.oecd.org/dac/stats/idsonline.
Categorías:
Aid Effectiveness
Se ha actualizado:
23 abr 2017 año
Los indicadores de los cambios de valor en los últimos años
Máximo:
370.0 mil
1 ene 2004 año
A la fecha de observación
Valor
Cambio absoluto
El cambio con respecto al valor anterior
1 ene 1973 año
10.0 mil
+10.0 mil
0.0%
1 ene 1974 año
20.0 mil
+10.0 mil
100.0%
1 ene 1975 año
20.0 mil
0.0
0.0%
1 ene 1976 año
20.0 mil
0.0
0.0%
1 ene 1981 año
20.0 mil
0.0
0.0%
1 ene 1985 año
20.0 mil
0.0
0.0%
1 ene 1986 año
50.0 mil
+30.0 mil
150.0%
1 ene 1987 año
170.0 mil
+120.0 mil
240.0%
1 ene 1988 año
140.0 mil
-30.0 mil
-17.65%
1 ene 1989 año
100.0 mil
-40.0 mil
-28.57%
1 ene 1992 año
20.0 mil
-80.0 mil
-80.0%
1 ene 1993 año
20.0 mil
0.0
0.0%
1 ene 1995 año
30.0 mil
+10.0 mil
50.0%
1 ene 1996 año
10.0 mil
-20.0 mil
-66.67%
1 ene 1997 año
10.0 mil
0.0
0.0%
1 ene 2000 año
10.0 mil
0.0
0.0%
1 ene 2001 año
10.0 mil
0.0
0.0%
1 ene 2002 año
40.0 mil
+30.0 mil
300.0%
1 ene 2003 año
90.0 mil
+50.0 mil
125.0%
1 ene 2004 año
370.0 mil
+280.0 mil
311.11%
1 ene 2005 año
30.0 mil
-340.0 mil
-91.89%
1 ene 2007 año
20.0 mil
-10.0 mil
-33.33%
1 ene 2008 año
40.0 mil
+20.0 mil
100.0%
1 ene 2009 año
110.0 mil
+70.0 mil
175.0%
1 ene 2010 año
50.0 mil
-60.0 mil
-54.55%
1 ene 2011 año
100.0 mil
+50.0 mil
100.0%
1 ene 2012 año
50.0 mil
-50.0 mil
-50.0%
1 ene 2013 año
50.0 mil
0.0
0.0%
1 ene 2014 año
0.0
-50.0 mil
-100.0%
1 ene 2015 año
110.0 mil
+110.0 mil
%
Ranking de los países por los datos estadísticos actuales


Comentarios: