29
/es/
es
AIzaSyAYiBZKx7MnpbEhh9jyipgxe19OcubqV5w
April 1, 2024
68662
Antigua and Barbuda
ATG
true
2
1
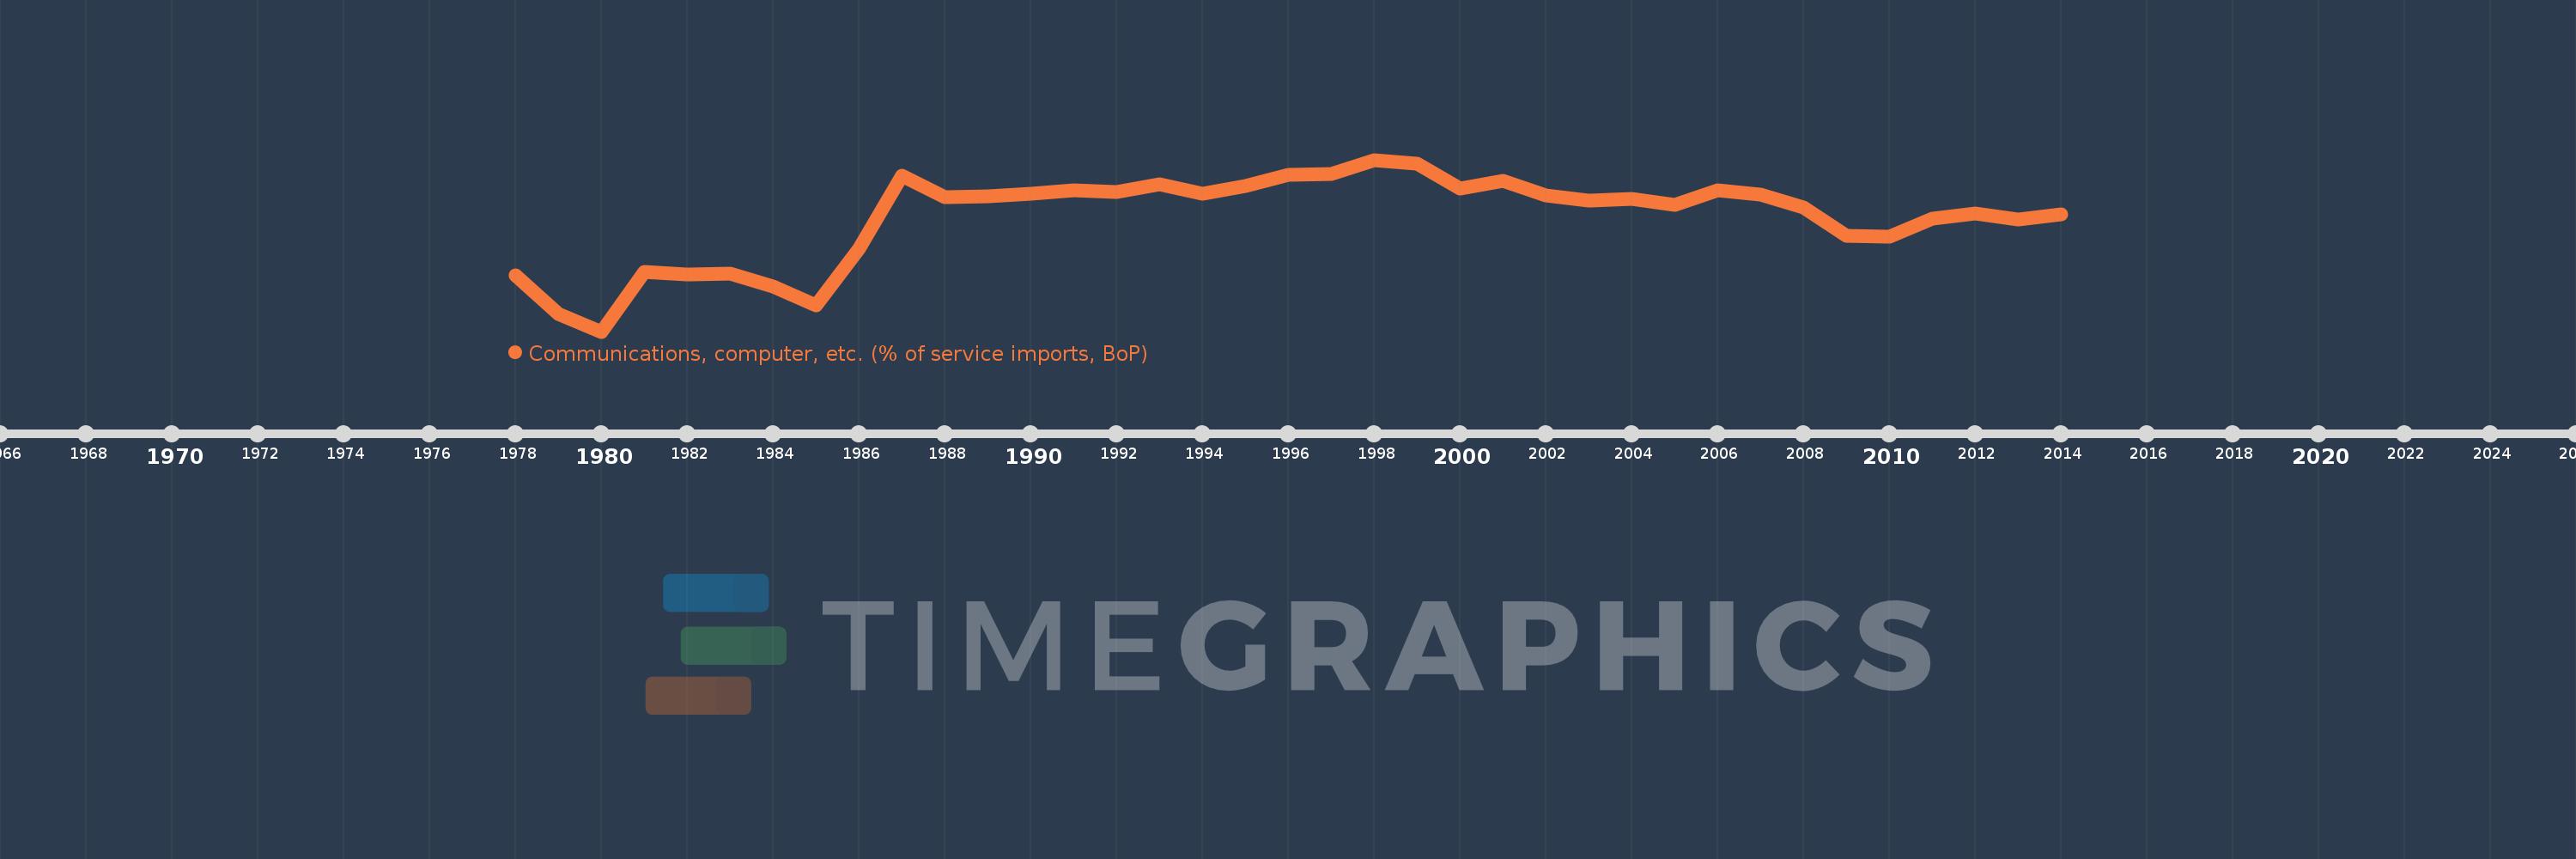
Communications, computer, etc. (% of service imports, BoP)
2014,2013,2012,2011,2010,2009,2008,2007,2006,2005,2004,2003,2002,2001,2000,1999,1998,1997,1996,1995,1994,1993,1992,1991,1990,1989,1988,1987,1986,1985,1984,1983,1982,1981,1980,1979,1978
Estas estadísticas en otros países:
AfghanistanAlbaniaAlgeriaAngolaAntigua and BarbudaArab WorldArgentinaArmeniaArubaAustraliaAustriaAzerbaijanBahamas, TheBahrainBangladeshBarbadosBelarusBelgiumBelizeBeninBermudaBhutanBoliviaBosnia and HerzegovinaBotswanaBrazilBrunei DarussalamBulgariaBurkina FasoBurundiCabo VerdeCambodiaCameroonCanadaCaribbean small statesCentral African RepublicCentral Europe and the BalticsChadChileChinaColombiaComorosCongo, Dem. Rep.Congo, Rep.Costa RicaCote d'IvoireCroatiaCuracaoCyprusCzech RepublicDenmarkDjiboutiDominicaDominican RepublicEarly-demographic dividendEast Asia & PacificEast Asia & Pacific (excluding high income)East Asia & Pacific (IDA & IBRD countries)EcuadorEgypt, Arab Rep.El SalvadorEquatorial GuineaEritreaEstoniaEthiopiaEuro areaEurope & Central AsiaEurope & Central Asia (excluding high income)Europe & Central Asia (IDA & IBRD countries)European UnionFaroe IslandsFijiFinlandFragile and conflict affected situationsFranceFrench PolynesiaGabonGambia, TheGeorgiaGermanyGhanaGreeceGrenadaGuatemalaGuineaGuinea-BissauGuyanaHaitiHeavily indebted poor countries (HIPC)High incomeHondurasHong Kong SAR, ChinaHungaryIBRD onlyIcelandIDA & IBRD totalIDA onlyIDA totalIndiaIndonesiaIran, Islamic Rep.IraqIrelandIsraelItalyJamaicaJapanJordanKazakhstanKenyaKiribatiKorea, Rep.KosovoKuwaitKyrgyz RepublicLao PDRLate-demographic dividendLatin America & Caribbean Latin America & Caribbean (excluding high income)Latin America & the Caribbean (IDA & IBRD countries)LatviaLeast developed countries: UN classificationLebanonLesothoLiberiaLibyaLithuaniaLow & middle incomeLow incomeLower middle incomeLuxembourgMacao SAR, ChinaMacedonia, FYRMadagascarMalawiMalaysiaMaldivesMaliMaltaMarshall IslandsMauritaniaMauritiusMexicoMicronesia, Fed. Sts.Middle East & North AfricaMiddle East & North Africa (excluding high income)Middle East & North Africa (IDA & IBRD countries)Middle incomeMoldovaMongoliaMontenegroMoroccoMozambiqueMyanmarNamibiaNepalNetherlandsNew CaledoniaNew ZealandNicaraguaNigerNigeriaNorth AmericaNorwayOECD membersOmanOther small statesPacific island small statesPakistanPalauPanamaPapua New GuineaParaguayPeruPhilippinesPolandPortugalPost-demographic dividendPre-demographic dividendQatarRomaniaRussian FederationRwandaSamoaSao Tome and PrincipeSaudi ArabiaSenegalSerbiaSeychellesSierra LeoneSingaporeSint Maarten (Dutch part)Slovak RepublicSloveniaSmall statesSolomon IslandsSouth AfricaSouth AsiaSouth Asia (IDA & IBRD)South SudanSpainSri LankaSt. Kitts and NevisSt. LuciaSt. Vincent and the GrenadinesSub-Saharan Africa Sub-Saharan Africa (excluding high income)Sub-Saharan Africa (IDA & IBRD countries)SudanSurinameSwazilandSwedenSwitzerlandSyrian Arab RepublicTajikistanTanzaniaThailandTimor-LesteTogoTongaTrinidad and TobagoTunisiaTurkeyTuvaluUgandaUkraineUnited KingdomUnited StatesUpper middle incomeUruguayVanuatuVenezuela, RBWest Bank and GazaWorldYemen, Rep.ZambiaZimbabwe línea de tiempo (timeline):
En esta escala de tiempo se presenta un gráfico de 1978 y 2014 de Antigua and Barbuda. Los datos de 1977 están ausentes. El número de observaciones reales por fecha: 37.
Fuente (nombre):
Indicadores del desarrollo mundial
Fuente (organización):
International Monetary Fund, Balance of Payments Statistics Yearbook and data files.
Categorías:
Economy & Growth, Trade
Se ha actualizado:
23 abr 2017 año
Los indicadores de los cambios de valor en los últimos años
Mínimo:
1.945
1 ene 1980 año
Máximo:
38.509
1 ene 1998 año
A la fecha de observación
Valor
Cambio absoluto
El cambio con respecto al valor anterior
1 ene 1978 año
13.846
+13.846
0.0%
1 ene 1979 año
5.705
-8.141
-58.8%
1 ene 1980 año
1.945
-3.76
-65.9%
1 ene 1981 año
14.633
+12.687
652.22%
1 ene 1982 año
14.184
-0.449
-3.07%
1 ene 1983 año
14.362
+0.178
1.25%
1 ene 1984 año
11.487
-2.875
-20.02%
1 ene 1985 año
7.508
-3.979
-34.64%
1 ene 1986 año
19.531
+12.023
160.13%
1 ene 1987 año
35.038
+15.507
79.39%
1 ene 1988 año
30.623
-4.415
-12.6%
1 ene 1989 año
30.671
+0.048
0.16%
1 ene 1990 año
31.376
+0.705
2.3%
1 ene 1991 año
32.017
+0.641
2.04%
1 ene 1992 año
31.732
-0.285
-0.89%
1 ene 1993 año
33.272
+1.54
4.85%
1 ene 1994 año
31.244
-2.028
-6.09%
1 ene 1995 año
33.0
+1.756
5.62%
1 ene 1996 año
35.278
+2.278
6.9%
1 ene 1997 año
35.49
+0.212
0.6%
1 ene 1998 año
38.509
+3.019
8.51%
1 ene 1999 año
37.711
-0.799
-2.07%
1 ene 2000 año
32.423
-5.287
-14.02%
1 ene 2001 año
34.064
+1.64
5.06%
1 ene 2002 año
30.974
-3.09
-9.07%
1 ene 2003 año
29.839
-1.135
-3.66%
1 ene 2004 año
30.183
+0.344
1.15%
1 ene 2005 año
28.826
-1.356
-4.49%
1 ene 2006 año
32.025
+3.198
11.1%
1 ene 2007 año
31.167
-0.858
-2.68%
1 ene 2008 año
28.343
-2.824
-9.06%
1 ene 2009 año
22.398
-5.945
-20.98%
1 ene 2010 año
22.136
-0.262
-1.17%
1 ene 2011 año
25.954
+3.818
17.25%
1 ene 2012 año
27.09
+1.136
4.38%
1 ene 2013 año
25.866
-1.224
-4.52%
1 ene 2014 año
26.878
+1.012
3.91%
Ranking de los países por los datos estadísticos actuales


Comentarios: