29
/es/
es
AIzaSyAYiBZKx7MnpbEhh9jyipgxe19OcubqV5w
April 1, 2024
68644
Antigua and Barbuda
ATG
true
2
1
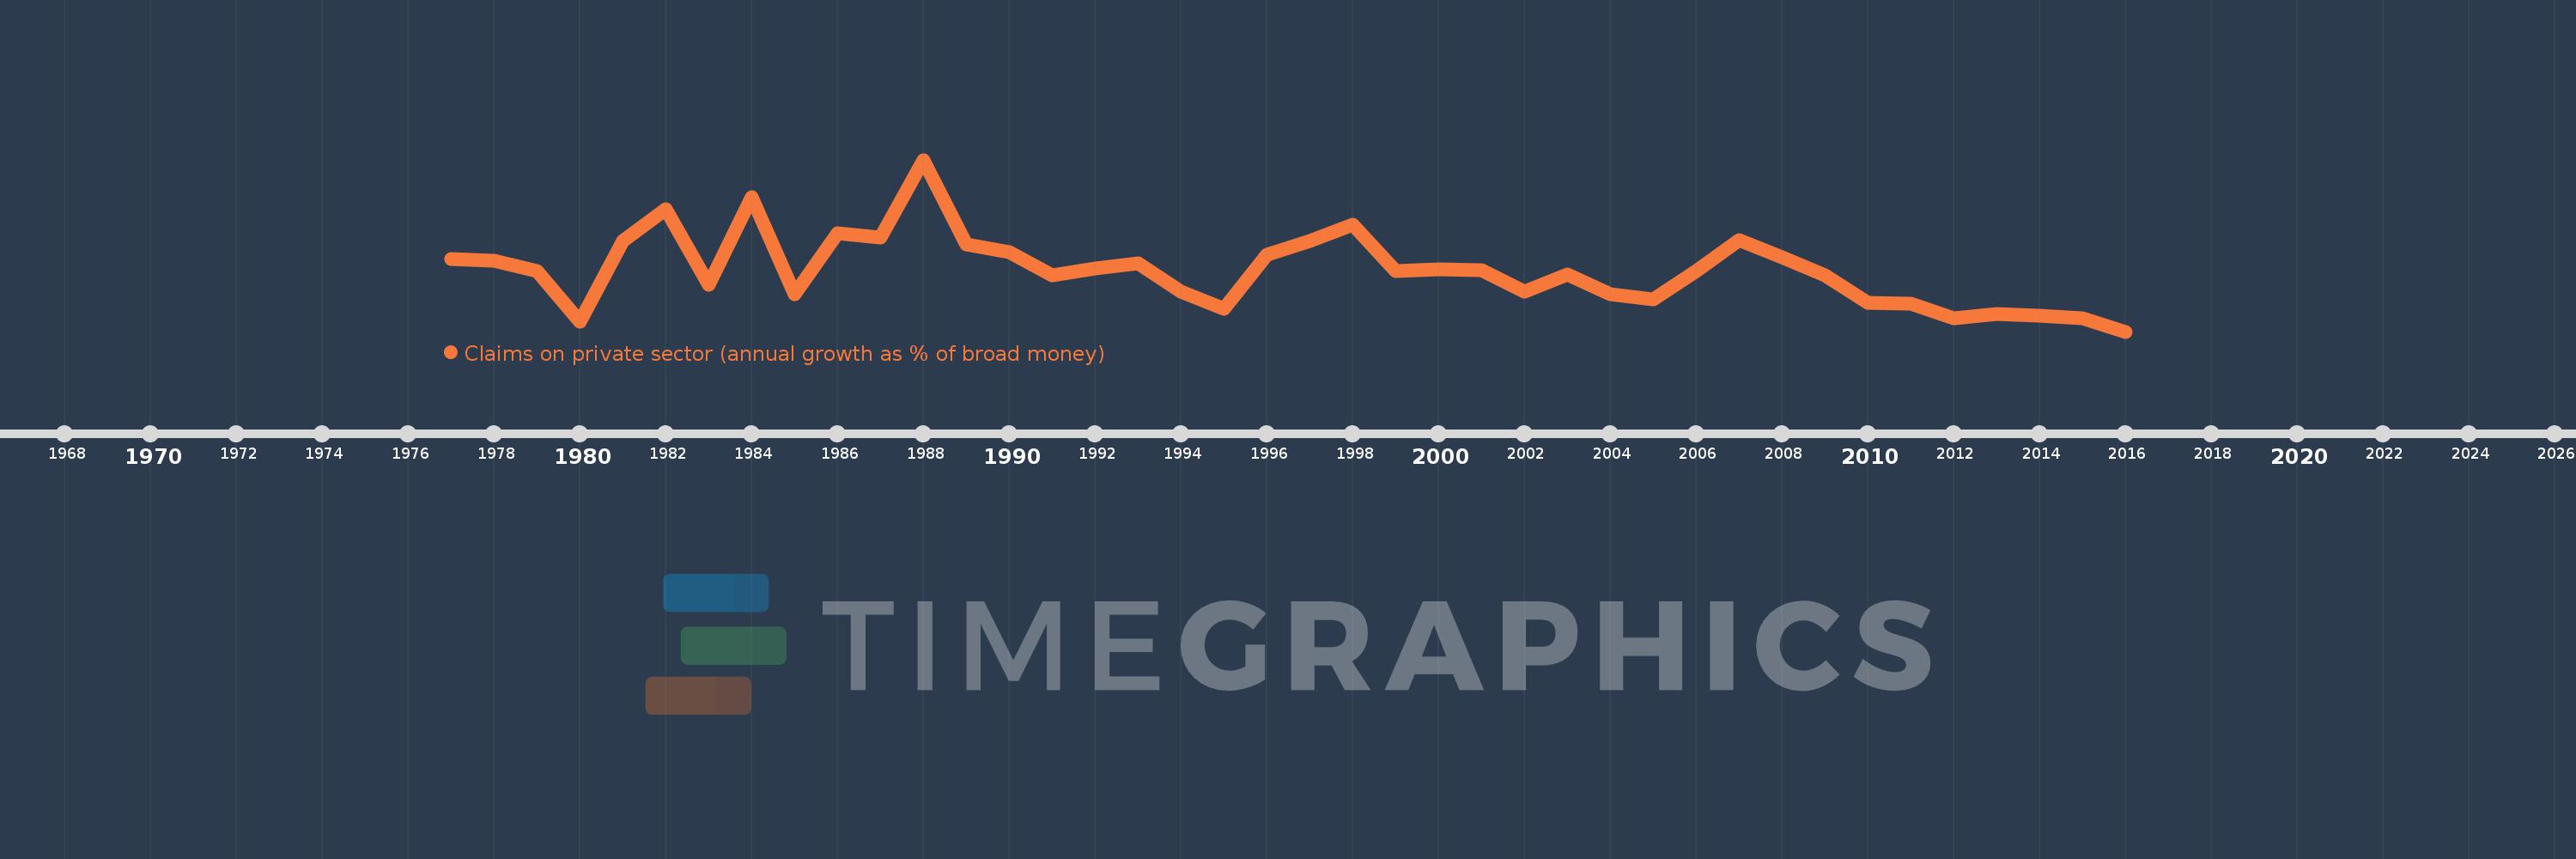
Claims on private sector (annual growth as % of broad money)
2016,2015,2014,2013,2012,2011,2010,2009,2008,2007,2006,2005,2004,2003,2002,2001,2000,1999,1998,1997,1996,1995,1994,1993,1992,1991,1990,1989,1988,1987,1986,1985,1984,1983,1982,1981,1980,1979,1978,1977
Estas estadísticas en otros países:
AfghanistanAlbaniaAlgeriaAngolaAntigua and BarbudaArgentinaArmeniaArubaAustraliaAzerbaijanBahamas, TheBahrainBangladeshBarbadosBelarusBelizeBeninBhutanBoliviaBosnia and HerzegovinaBotswanaBrazilBrunei DarussalamBulgariaBurkina FasoBurundiCabo VerdeCambodiaCameroonCanadaCentral African RepublicChadChileChinaColombiaComorosCongo, Dem. Rep.Congo, Rep.Costa RicaCote d'IvoireCroatiaCzech RepublicDenmarkDjiboutiDominicaDominican RepublicEcuadorEgypt, Arab Rep.El SalvadorEquatorial GuineaEritreaEstoniaEthiopiaFijiGabonGambia, TheGeorgiaGhanaGrenadaGuatemalaGuineaGuinea-BissauGuyanaHaitiHondurasHong Kong SAR, ChinaHungaryIcelandIndiaIndonesiaIran, Islamic Rep.IraqIsraelJamaicaJapanJordanKazakhstanKenyaKorea, Rep.KuwaitKyrgyz RepublicLao PDRLatviaLebanonLesothoLiberiaLibyaLithuaniaMacao SAR, ChinaMacedonia, FYRMadagascarMalawiMalaysiaMaldivesMaliMauritaniaMauritiusMexicoMicronesia, Fed. Sts.MoldovaMongoliaMoroccoMozambiqueMyanmarNamibiaNepalNew ZealandNicaraguaNigerNigeriaNorwayOmanPakistanPanamaPapua New GuineaParaguayPeruPhilippinesPolandQatarRomaniaRussian FederationRwandaSamoaSao Tome and PrincipeSaudi ArabiaSenegalSerbiaSeychellesSierra LeoneSingaporeSlovak RepublicSolomon IslandsSouth AfricaSouth SudanSri LankaSt. Kitts and NevisSt. LuciaSt. Vincent and the GrenadinesSudanSurinameSwazilandSwedenSwitzerlandSyrian Arab RepublicTajikistanTanzaniaThailandTimor-LesteTogoTongaTrinidad and TobagoTunisiaTurkeyUgandaUkraineUnited Arab EmiratesUnited KingdomUnited StatesUruguayVanuatuVenezuela, RBVietnamWest Bank and GazaYemen, Rep.ZambiaZimbabwe línea de tiempo (timeline):
En esta escala de tiempo se presenta un gráfico de 1977 y 2016 de Antigua and Barbuda. Los datos de 1976 están ausentes. El número de observaciones reales por fecha: 40.
Fuente (nombre):
Indicadores del desarrollo mundial
Fuente (organización):
International Monetary Fund, International Financial Statistics and data files.
Categorías:
Financial Sector
Se ha actualizado:
23 abr 2017 año
Los indicadores de los cambios de valor en los últimos años
Mínimo:
-6.144
1 ene 2016 año
Máximo:
30.096
1 ene 1988 año
A la fecha de observación
Valor
Cambio absoluto
El cambio con respecto al valor anterior
1 ene 1977 año
9.147
+9.147
0.0%
1 ene 1978 año
8.842
-0.305
-3.34%
1 ene 1979 año
6.635
-2.207
-24.96%
1 ene 1980 año
-4.118
-10.753
-162.06%
1 ene 1981 año
12.883
+17.001
-412.86%
1 ene 1982 año
19.696
+6.813
52.88%
1 ene 1983 año
3.8
-15.896
-80.71%
1 ene 1984 año
22.159
+18.359
483.16%
1 ene 1985 año
1.666
-20.493
-92.48%
1 ene 1986 año
14.518
+12.852
771.48%
1 ene 1987 año
13.707
-0.811
-5.59%
1 ene 1988 año
30.096
+16.389
119.56%
1 ene 1989 año
12.178
-17.918
-59.54%
1 ene 1990 año
10.605
-1.573
-12.92%
1 ene 1991 año
5.735
-4.87
-45.92%
1 ene 1992 año
7.127
+1.392
24.26%
1 ene 1993 año
8.307
+1.18
16.56%
1 ene 1994 año
2.303
-6.004
-72.28%
1 ene 1995 año
-1.354
-3.657
-158.77%
1 ene 1996 año
10.079
+11.433
-844.57%
1 ene 1997 año
12.985
+2.906
28.83%
1 ene 1998 año
16.333
+3.348
25.78%
1 ene 1999 año
6.583
-9.75
-59.69%
1 ene 2000 año
6.967
+0.384
5.83%
1 ene 2001 año
6.748
-0.219
-3.14%
1 ene 2002 año
2.305
-4.443
-65.84%
1 ene 2003 año
5.861
+3.556
154.26%
1 ene 2004 año
1.775
-4.086
-69.71%
1 ene 2005 año
0.733
-1.042
-58.72%
1 ene 2006 año
6.595
+5.862
799.83%
1 ene 2007 año
13.069
+6.474
98.17%
1 ene 2008 año
9.59
-3.478
-26.62%
1 ene 2009 año
5.667
-3.924
-40.92%
1 ene 2010 año
-0.115
-5.782
-102.03%
1 ene 2011 año
-0.341
-0.225
195.58%
1 ene 2012 año
-3.28
-2.94
862.7%
1 ene 2013 año
-2.405
+0.876
-26.7%
1 ene 2014 año
-2.77
-0.365
15.18%
1 ene 2015 año
-3.367
-0.597
21.56%
1 ene 2016 año
-6.144
-2.777
82.48%
Ranking de los países por los datos estadísticos actuales


Comentarios: