29
/es/
es
AIzaSyAYiBZKx7MnpbEhh9jyipgxe19OcubqV5w
April 1, 2024
64432
Albania
ALB
true
2
1
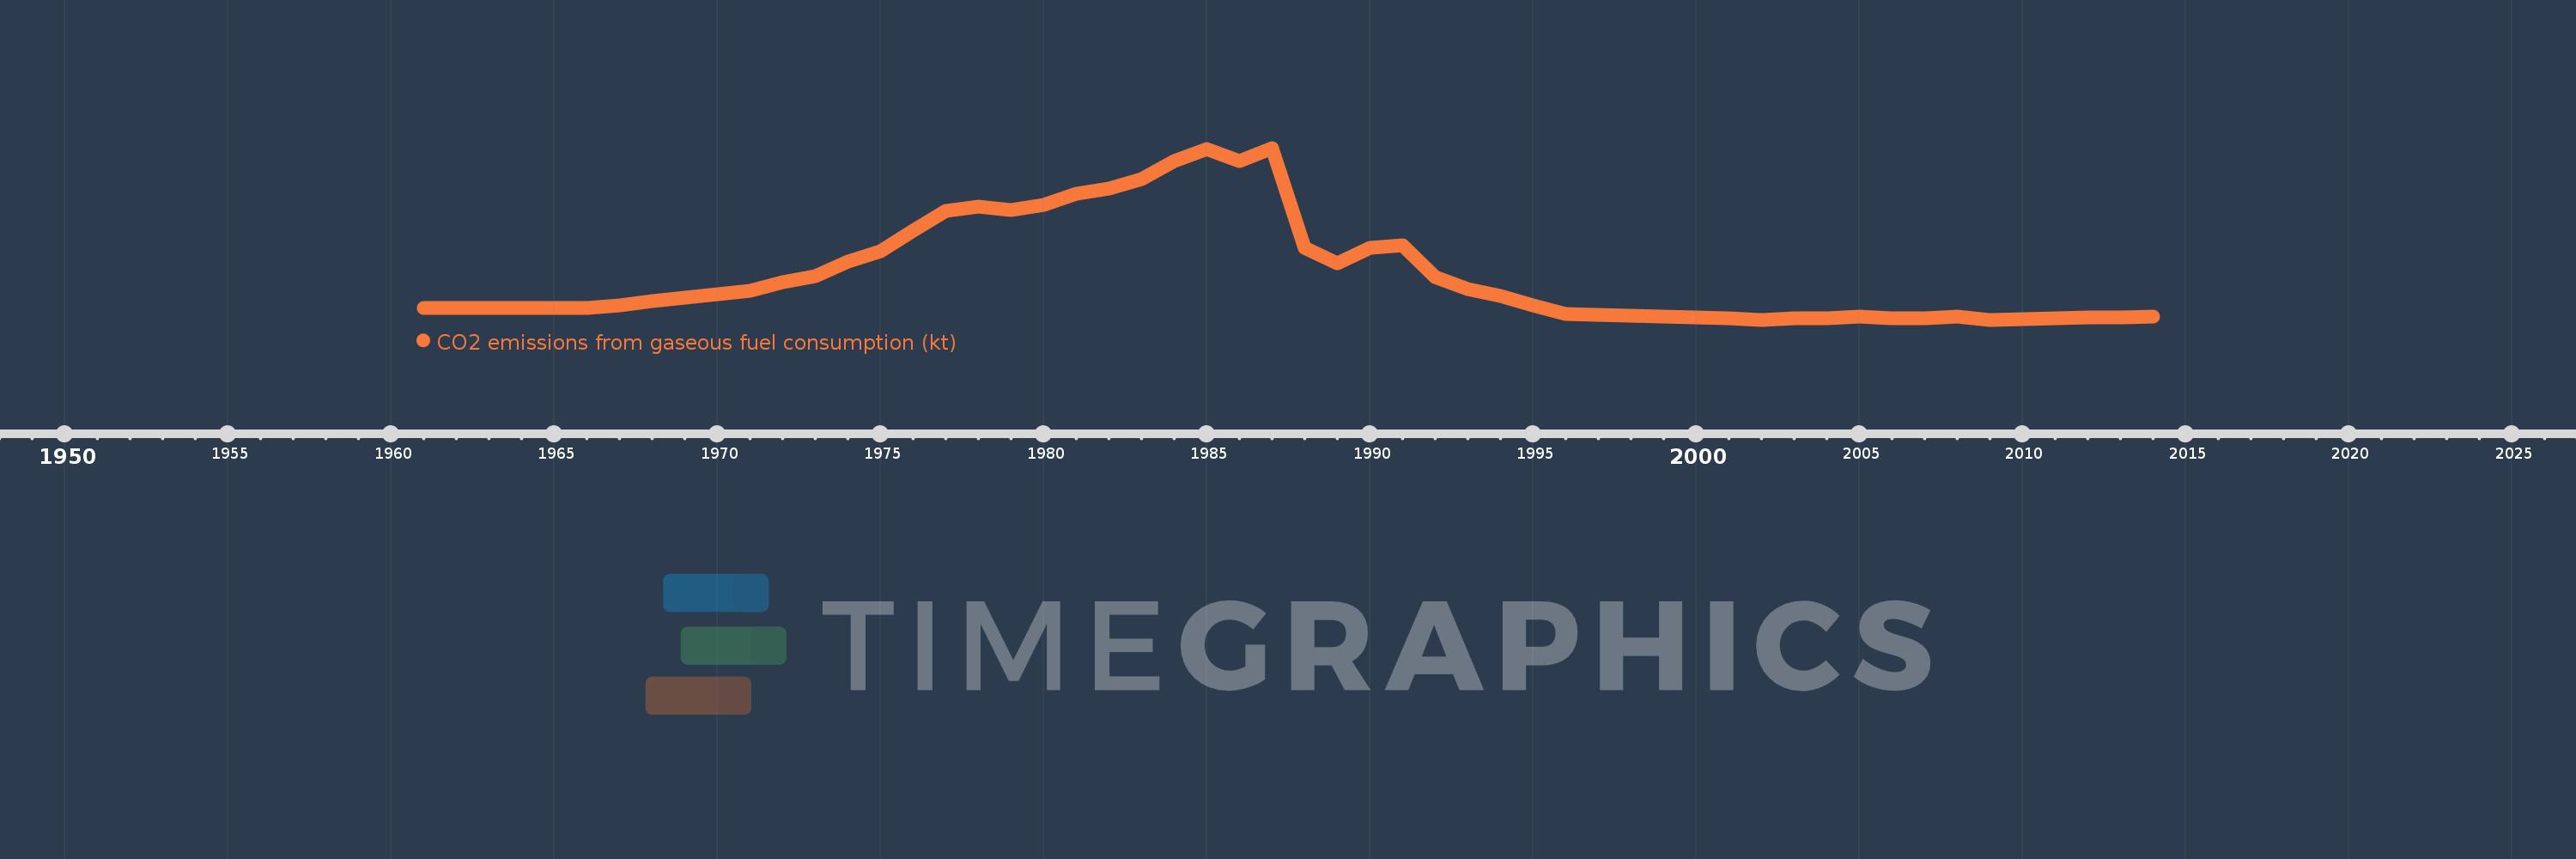
CO2 emissions from gaseous fuel consumption (kt)
2014,2013,2012,2011,2010,2009,2008,2007,2006,2005,2004,2003,2002,2001,2000,1999,1998,1997,1996,1995,1994,1993,1992,1991,1990,1989,1988,1987,1986,1985,1984,1983,1982,1981,1980,1979,1978,1977,1976,1975,1974,1973,1972,1971,1970,1969,1968,1967,1966,1965,1964,1963,1962,1961
Estas estadísticas en otros países:
AfghanistanAlbaniaAlgeriaAndorraAngolaAntigua and BarbudaArab WorldArgentinaArmeniaArubaAustraliaAustriaAzerbaijanBahamas, TheBahrainBangladeshBarbadosBelarusBelgiumBelizeBeninBermudaBhutanBoliviaBosnia and HerzegovinaBotswanaBrazilBritish Virgin IslandsBrunei DarussalamBulgariaBurkina FasoBurundiCabo VerdeCambodiaCameroonCanadaCayman IslandsCentral African RepublicCentral Europe and the BalticsChadChileChinaColombiaComorosCongo, Dem. Rep.Congo, Rep.Costa RicaCote d'IvoireCroatiaCubaCuracaoCyprusCzech RepublicDenmarkDjiboutiDominicaDominican RepublicEarly-demographic dividendEast Asia & PacificEast Asia & Pacific (excluding high income)East Asia & Pacific (IDA & IBRD countries)EcuadorEgypt, Arab Rep.El SalvadorEquatorial GuineaEritreaEstoniaEthiopiaEuro areaEurope & Central AsiaEurope & Central Asia (excluding high income)Europe & Central Asia (IDA & IBRD countries)European UnionFaroe IslandsFijiFinlandFragile and conflict affected situationsFranceFrench PolynesiaGabonGambia, TheGeorgiaGermanyGhanaGibraltarGreeceGreenlandGrenadaGuatemalaGuineaGuinea-BissauGuyanaHaitiHigh incomeHondurasHong Kong SAR, ChinaHungaryIBRD onlyIcelandIDA & IBRD totalIDA blendIDA totalIndiaIndonesiaIran, Islamic Rep.IraqIrelandIsraelItalyJamaicaJapanJordanKazakhstanKenyaKiribatiKorea, Dem. People’s Rep.Korea, Rep.KuwaitKyrgyz RepublicLao PDRLate-demographic dividendLatin America & Caribbean Latin America & Caribbean (excluding high income)Latin America & the Caribbean (IDA & IBRD countries)LatviaLebanonLesothoLiberiaLibyaLiechtensteinLithuaniaLow & middle incomeLower middle incomeLuxembourgMacao SAR, ChinaMacedonia, FYRMadagascarMalawiMalaysiaMaldivesMaliMaltaMarshall IslandsMauritaniaMauritiusMexicoMicronesia, Fed. Sts.Middle East & North AfricaMiddle East & North Africa (excluding high income)Middle East & North Africa (IDA & IBRD countries)Middle incomeMoldovaMongoliaMontenegroMoroccoMozambiqueMyanmarNamibiaNauruNepalNetherlandsNew CaledoniaNew ZealandNicaraguaNigerNigeriaNorth AmericaNorwayOECD membersOmanPakistanPalauPanamaPapua New GuineaParaguayPeruPhilippinesPolandPortugalPost-demographic dividendPre-demographic dividendQatarRomaniaRussian FederationRwandaSamoaSao Tome and PrincipeSaudi ArabiaSenegalSerbiaSeychellesSierra LeoneSingaporeSint Maarten (Dutch part)Slovak RepublicSloveniaSolomon IslandsSomaliaSouth AfricaSouth AsiaSouth Asia (IDA & IBRD)South SudanSpainSri LankaSt. Kitts and NevisSt. LuciaSt. Vincent and the GrenadinesSub-Saharan Africa Sub-Saharan Africa (excluding high income)Sub-Saharan Africa (IDA & IBRD countries)SudanSurinameSwazilandSwedenSwitzerlandSyrian Arab RepublicTajikistanTanzaniaThailandTimor-LesteTogoTongaTrinidad and TobagoTunisiaTurkeyTurkmenistanTurks and Caicos IslandsUgandaUkraineUnited Arab EmiratesUnited KingdomUnited StatesUpper middle incomeUruguayUzbekistanVanuatuVenezuela, RBVietnamWest Bank and GazaWorldYemen, Rep.ZambiaZimbabwe línea de tiempo (timeline):
En esta escala de tiempo se presenta un gráfico de 1961 y 2014 de Albania. Los datos de 1960 están ausentes. El número de observaciones reales por fecha: 54.
Fuente (nombre):
Indicadores del desarrollo mundial
Fuente (organización):
Carbon Dioxide Information Analysis Center, Environmental Sciences Division, Oak Ridge National Laboratory, Tennessee, United States.
Categorías:
Climate Change, Environment
Se ha actualizado:
23 abr 2017 año
Los indicadores de los cambios de valor en los últimos años
Mínimo:
14.668
1 ene 2002 año
Máximo:
1.052 mil
1 ene 1987 año
A la fecha de observación
Valor
Cambio absoluto
El cambio con respecto al valor anterior
1 ene 1961 año
84.341
+84.341
0.0%
1 ene 1962 año
84.341
0.0
0.0%
1 ene 1963 año
84.341
0.0
0.0%
1 ene 1964 año
84.341
0.0
0.0%
1 ene 1965 año
84.341
0.0
0.0%
1 ene 1966 año
84.341
0.0
0.0%
1 ene 1967 año
102.676
+18.335
21.74%
1 ene 1968 año
128.345
+25.669
25.0%
1 ene 1969 año
146.68
+18.335
14.29%
1 ene 1970 año
168.682
+22.002
15.0%
1 ene 1971 año
187.017
+18.335
10.87%
1 ene 1972 año
242.022
+55.005
29.41%
1 ene 1973 año
278.692
+36.67
15.15%
1 ene 1974 año
366.7
+88.008
31.58%
1 ene 1975 año
429.039
+62.339
17.0%
1 ene 1976 año
553.717
+124.678
29.06%
1 ene 1977 año
671.061
+117.344
21.19%
1 ene 1978 año
700.397
+29.336
4.37%
1 ene 1979 año
678.395
-22.002
-3.14%
1 ene 1980 año
707.731
+29.336
4.32%
1 ene 1981 año
773.737
+66.006
9.33%
1 ene 1982 año
806.74
+33.003
4.27%
1 ene 1983 año
865.412
+58.672
7.27%
1 ene 1984 año
975.422
+110.01
12.71%
1 ene 1985 año
1.045 mil
+69.673
7.14%
1 ene 1986 año
971.755
-73.34
-7.02%
1 ene 1987 año
1.052 mil
+80.674
8.3%
1 ene 1988 año
451.041
-601.388
-57.14%
1 ene 1989 año
355.699
-95.342
-21.14%
1 ene 1990 año
447.374
+91.675
25.77%
1 ene 1991 año
465.709
+18.335
4.1%
1 ene 1992 año
275.025
-190.684
-40.94%
1 ene 1993 año
198.018
-77.007
-28.0%
1 ene 1994 año
157.681
-40.337
-20.37%
1 ene 1995 año
99.009
-58.672
-37.21%
1 ene 1996 año
51.338
-47.671
-48.15%
1 ene 1997 año
44.004
-7.334
-14.29%
1 ene 1998 año
36.67
-7.334
-16.67%
1 ene 1999 año
33.003
-3.667
-10.0%
1 ene 2000 año
29.336
-3.667
-11.11%
1 ene 2001 año
22.002
-7.334
-25.0%
1 ene 2002 año
14.668
-7.334
-33.33%
1 ene 2003 año
25.669
+11.001
75.0%
1 ene 2004 año
25.669
0.0
0.0%
1 ene 2005 año
33.003
+7.334
28.57%
1 ene 2006 año
22.002
-11.001
-33.33%
1 ene 2007 año
22.002
0.0
0.0%
1 ene 2008 año
33.003
+11.001
50.0%
1 ene 2009 año
14.668
-18.335
-55.56%
1 ene 2010 año
18.335
+3.667
25.0%
1 ene 2011 año
25.669
+7.334
40.0%
1 ene 2012 año
29.336
+3.667
14.29%
1 ene 2013 año
29.336
0.0
0.0%
1 ene 2014 año
33.003
+3.667
12.5%
Ranking de los países por los datos estadísticos actuales


Comentarios: