29
/es/
es
AIzaSyAYiBZKx7MnpbEhh9jyipgxe19OcubqV5w
April 1, 2024
60468
Sub-Saharan Africa (excluding high income)
SSA
false
2
1
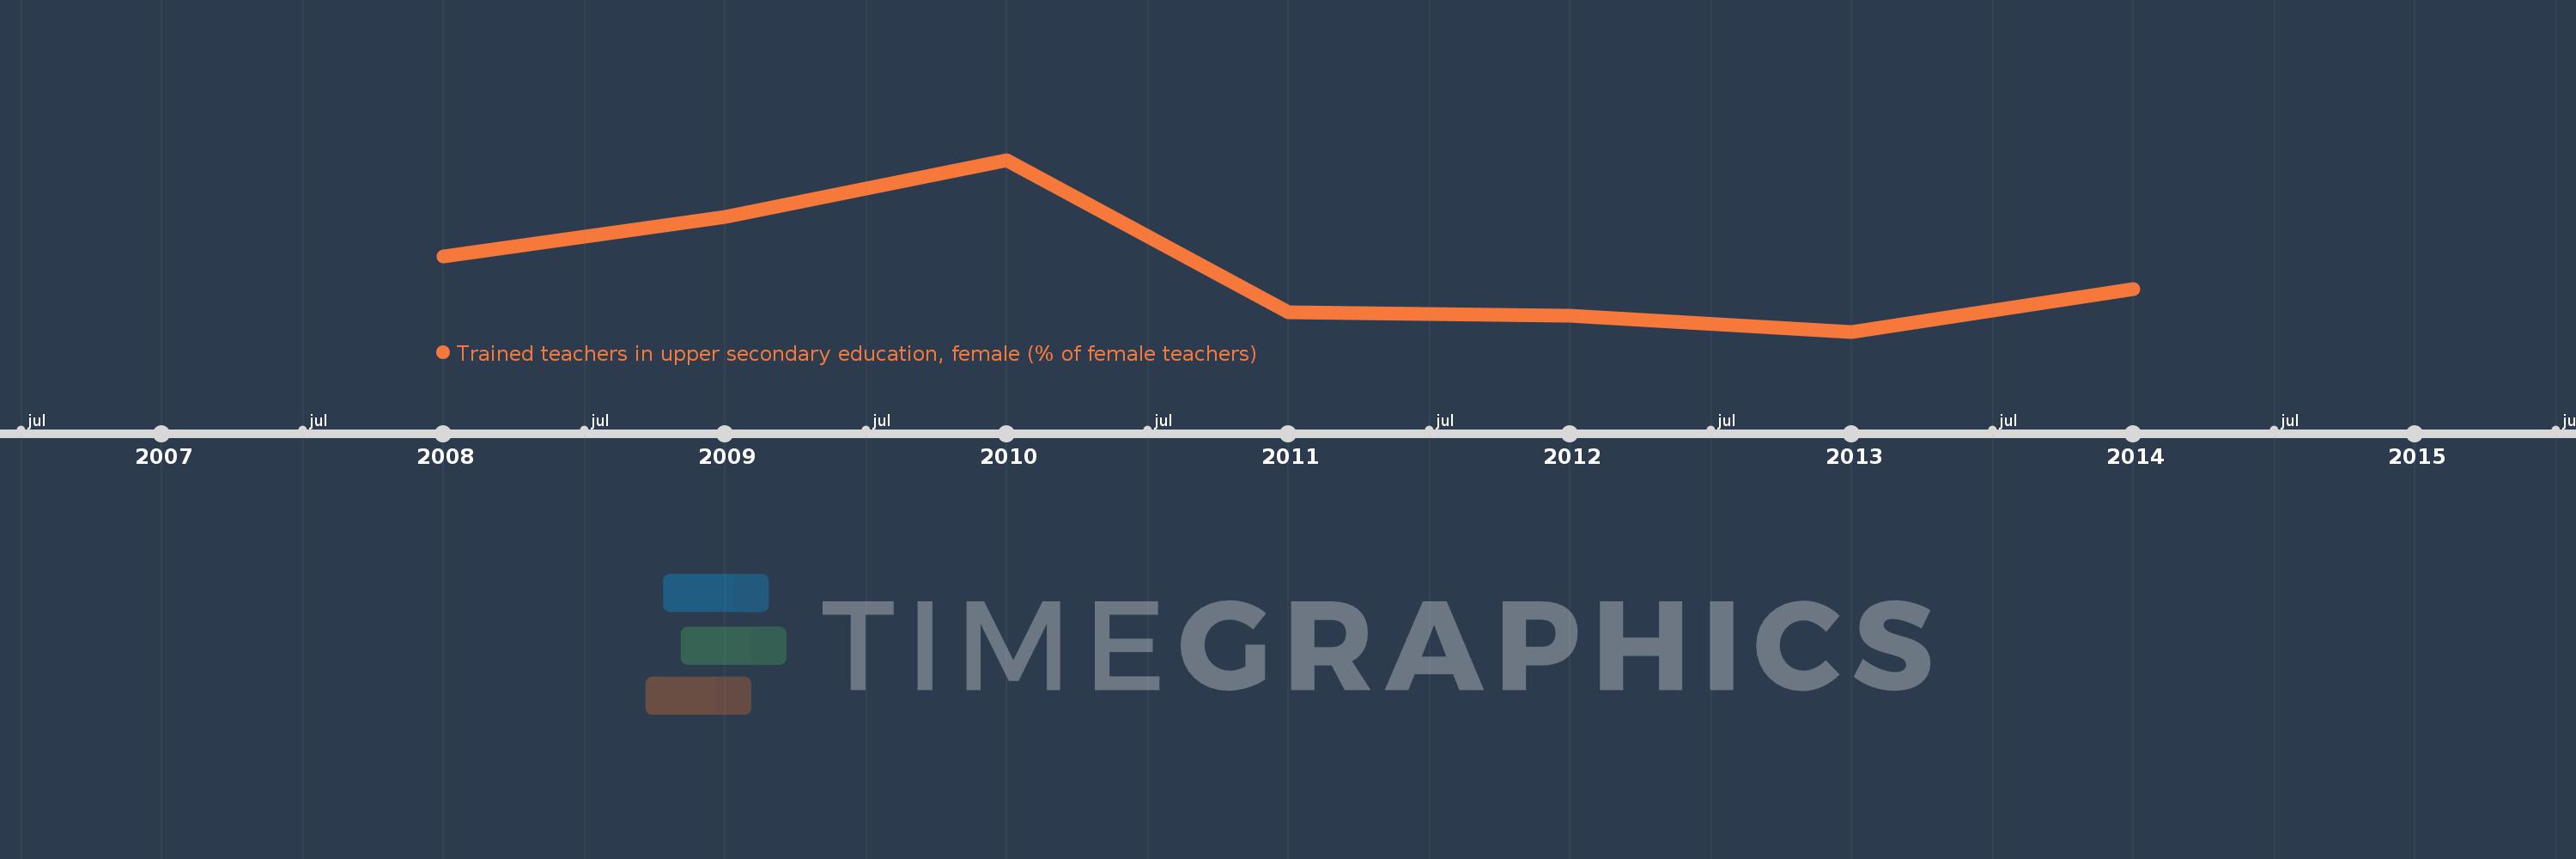
Trained teachers in upper secondary education, female (% of female teachers)
2014,2013,2012,2011,2010,2009,2008
Estas estadísticas en otros países:
línea de tiempo (timeline):
En esta escala de tiempo se presenta un gráfico de 2008 y 2014 de Sub-Saharan Africa (excluding high income). Los datos de 2007 están ausentes. El número de observaciones reales por fecha: 7.
Fuente (nombre):
Indicadores del desarrollo mundial
Fuente (organización):
United Nations Educational, Scientific, and Cultural Organization (UNESCO) Institute for Statistics.
Categorías:
Education
Se ha actualizado:
23 abr 2017 año
Los indicadores de los cambios de valor en los últimos años
Mínimo:
53.81
1 ene 2013 año
Máximo:
78.663
1 ene 2010 año
A la fecha de observación
Valor
Cambio absoluto
El cambio con respecto al valor anterior
1 ene 2008 año
64.714
+64.714
0.0%
1 ene 2009 año
70.399
+5.685
8.79%
1 ene 2010 año
78.663
+8.263
11.74%
1 ene 2011 año
56.615
-22.047
-28.03%
1 ene 2012 año
56.047
-0.568
-1.0%
1 ene 2013 año
53.81
-2.237
-3.99%
1 ene 2014 año
59.989
+6.179
11.48%
Ranking de los países por los datos estadísticos actuales


Comentarios: