29
/es/
es
AIzaSyAYiBZKx7MnpbEhh9jyipgxe19OcubqV5w
April 1, 2024
59673
Sub-Saharan Africa (excluding high income)
SSA
false
2
1
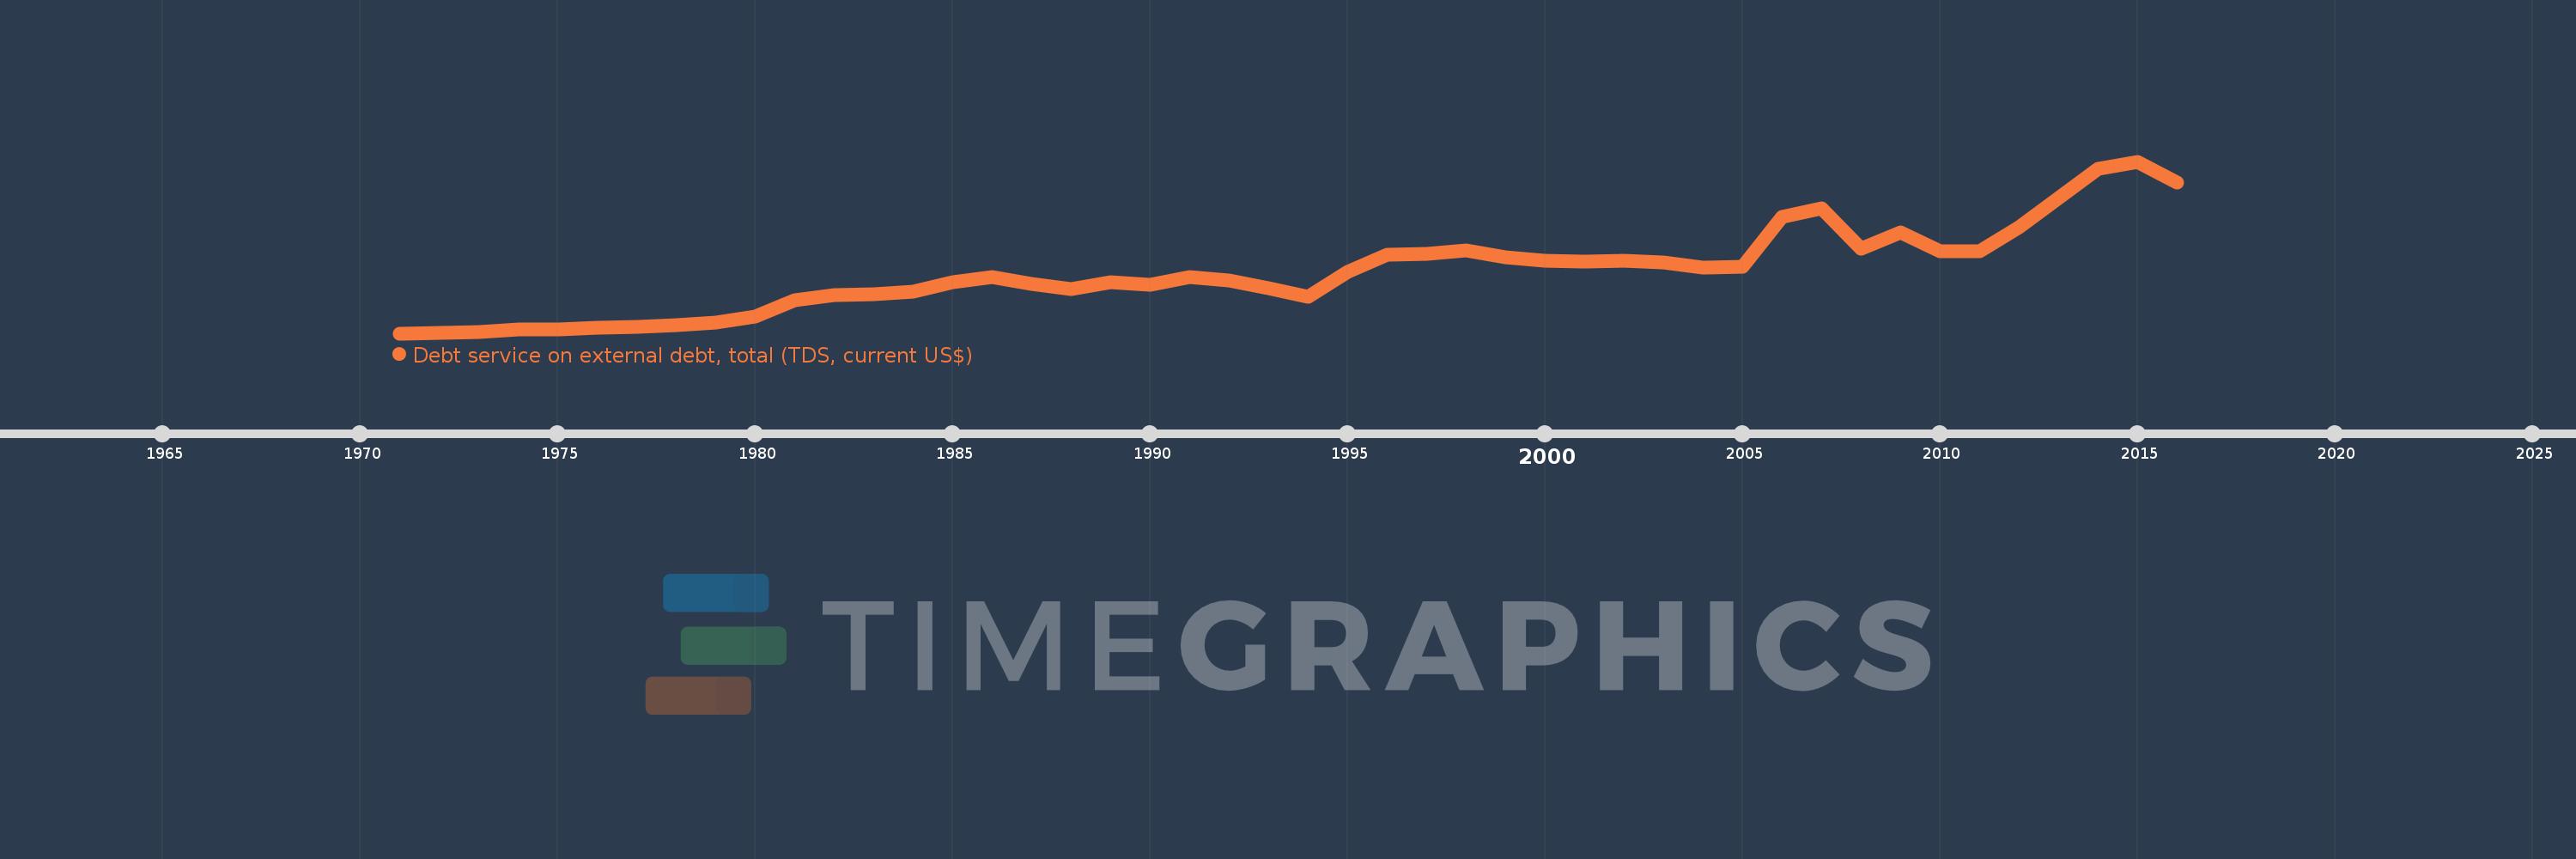
Debt service on external debt, total (TDS, current US$)
2016,2015,2014,2013,2012,2011,2010,2009,2008,2007,2006,2005,2004,2003,2002,2001,2000,1999,1998,1997,1996,1995,1994,1993,1992,1991,1990,1989,1988,1987,1986,1985,1984,1983,1982,1981,1980,1979,1978,1977,1976,1975,1974,1973,1972,1971
Estas estadísticas en otros países:
línea de tiempo (timeline):
En esta escala de tiempo se presenta un gráfico de 1971 y 2016 de Sub-Saharan Africa (excluding high income). Los datos de 1970 están ausentes. El número de observaciones reales por fecha: 46.
Fuente (nombre):
Indicadores del desarrollo mundial
Fuente (organización):
World Bank, International Debt Statistics.
Categorías:
External Debt
Se ha actualizado:
23 abr 2017 año
Los indicadores de los cambios de valor en los últimos años
Mínimo:
643.182 millones
1 ene 1971 año
Máximo:
31.555 bn
1 ene 2015 año
A la fecha de observación
Valor
Cambio absoluto
El cambio con respecto al valor anterior
1 ene 1971 año
643.182 millones
+643.182 millones
0.0%
1 ene 1972 año
717.018 millones
+73.836 millones
11.48%
1 ene 1973 año
803.078 millones
+86.06 millones
12.0%
1 ene 1974 año
1.386 bn
+582.523 millones
72.54%
1 ene 1975 año
1.264 bn
-121.995 millones
-8.8%
1 ene 1976 año
1.614 bn
+350.573 millones
27.74%
1 ene 1977 año
1.822 bn
+208.151 millones
12.9%
1 ene 1978 año
2.112 bn
+289.979 millones
15.91%
1 ene 1979 año
2.585 bn
+472.439 millones
22.37%
1 ene 1980 año
3.598 bn
+1.014 bn
39.21%
1 ene 1981 año
6.618 bn
+3.02 bn
83.92%
1 ene 1982 año
7.57 bn
+952.079 millones
14.39%
1 ene 1983 año
7.674 bn
+104.321 millones
1.38%
1 ene 1984 año
8.081 bn
+406.534 millones
5.3%
1 ene 1985 año
9.843 bn
+1.762 bn
21.81%
1 ene 1986 año
10.8 bn
+956.66 millones
9.72%
1 ene 1987 año
9.506 bn
-1.294 bn
-11.98%
1 ene 1988 año
8.585 bn
-921.706 millones
-9.7%
1 ene 1989 año
9.795 bn
+1.21 bn
14.1%
1 ene 1990 año
9.354 bn
-440.968 millones
-4.5%
1 ene 1991 año
10.827 bn
+1.473 bn
15.75%
1 ene 1992 año
10.132 bn
-695.241 millones
-6.42%
1 ene 1993 año
8.715 bn
-1.417 bn
-13.98%
1 ene 1994 año
7.267 bn
-1.448 bn
-16.61%
1 ene 1995 año
11.737 bn
+4.47 bn
61.51%
1 ene 1996 año
14.75 bn
+3.013 bn
25.67%
1 ene 1997 año
14.924 bn
+173.983 millones
1.18%
1 ene 1998 año
15.614 bn
+689.587 millones
4.62%
1 ene 1999 año
14.256 bn
-1.358 bn
-8.7%
1 ene 2000 año
13.644 bn
-612.082 millones
-4.29%
1 ene 2001 año
13.595 bn
-48.171 millones
-0.35%
1 ene 2002 año
13.764 bn
+168.201 millones
1.24%
1 ene 2003 año
13.353 bn
-410.181 millones
-2.98%
1 ene 2004 año
12.488 bn
-865.805 millones
-6.48%
1 ene 2005 año
12.656 bn
+167.88 millones
1.34%
1 ene 2006 año
21.53 bn
+8.874 bn
70.12%
1 ene 2007 año
23.155 bn
+1.625 bn
7.55%
1 ene 2008 año
15.822 bn
-7.333 bn
-31.67%
1 ene 2009 año
18.822 bn
+3.0 bn
18.96%
1 ene 2010 año
15.446 bn
-3.376 bn
-17.93%
1 ene 2011 año
15.4 bn
-46.319 millones
-0.3%
1 ene 2012 año
19.684 bn
+4.284 bn
27.82%
1 ene 2013 año
24.927 bn
+5.243 bn
26.64%
1 ene 2014 año
30.25 bn
+5.323 bn
21.35%
1 ene 2015 año
31.555 bn
+1.305 bn
4.31%
1 ene 2016 año
27.807 bn
-3.747 bn
-11.88%
Ranking de los países por los datos estadísticos actuales


Comentarios: