29
/es/
es
AIzaSyAYiBZKx7MnpbEhh9jyipgxe19OcubqV5w
April 1, 2024
59551
Sub-Saharan Africa (excluding high income)
SSA
false
2
1
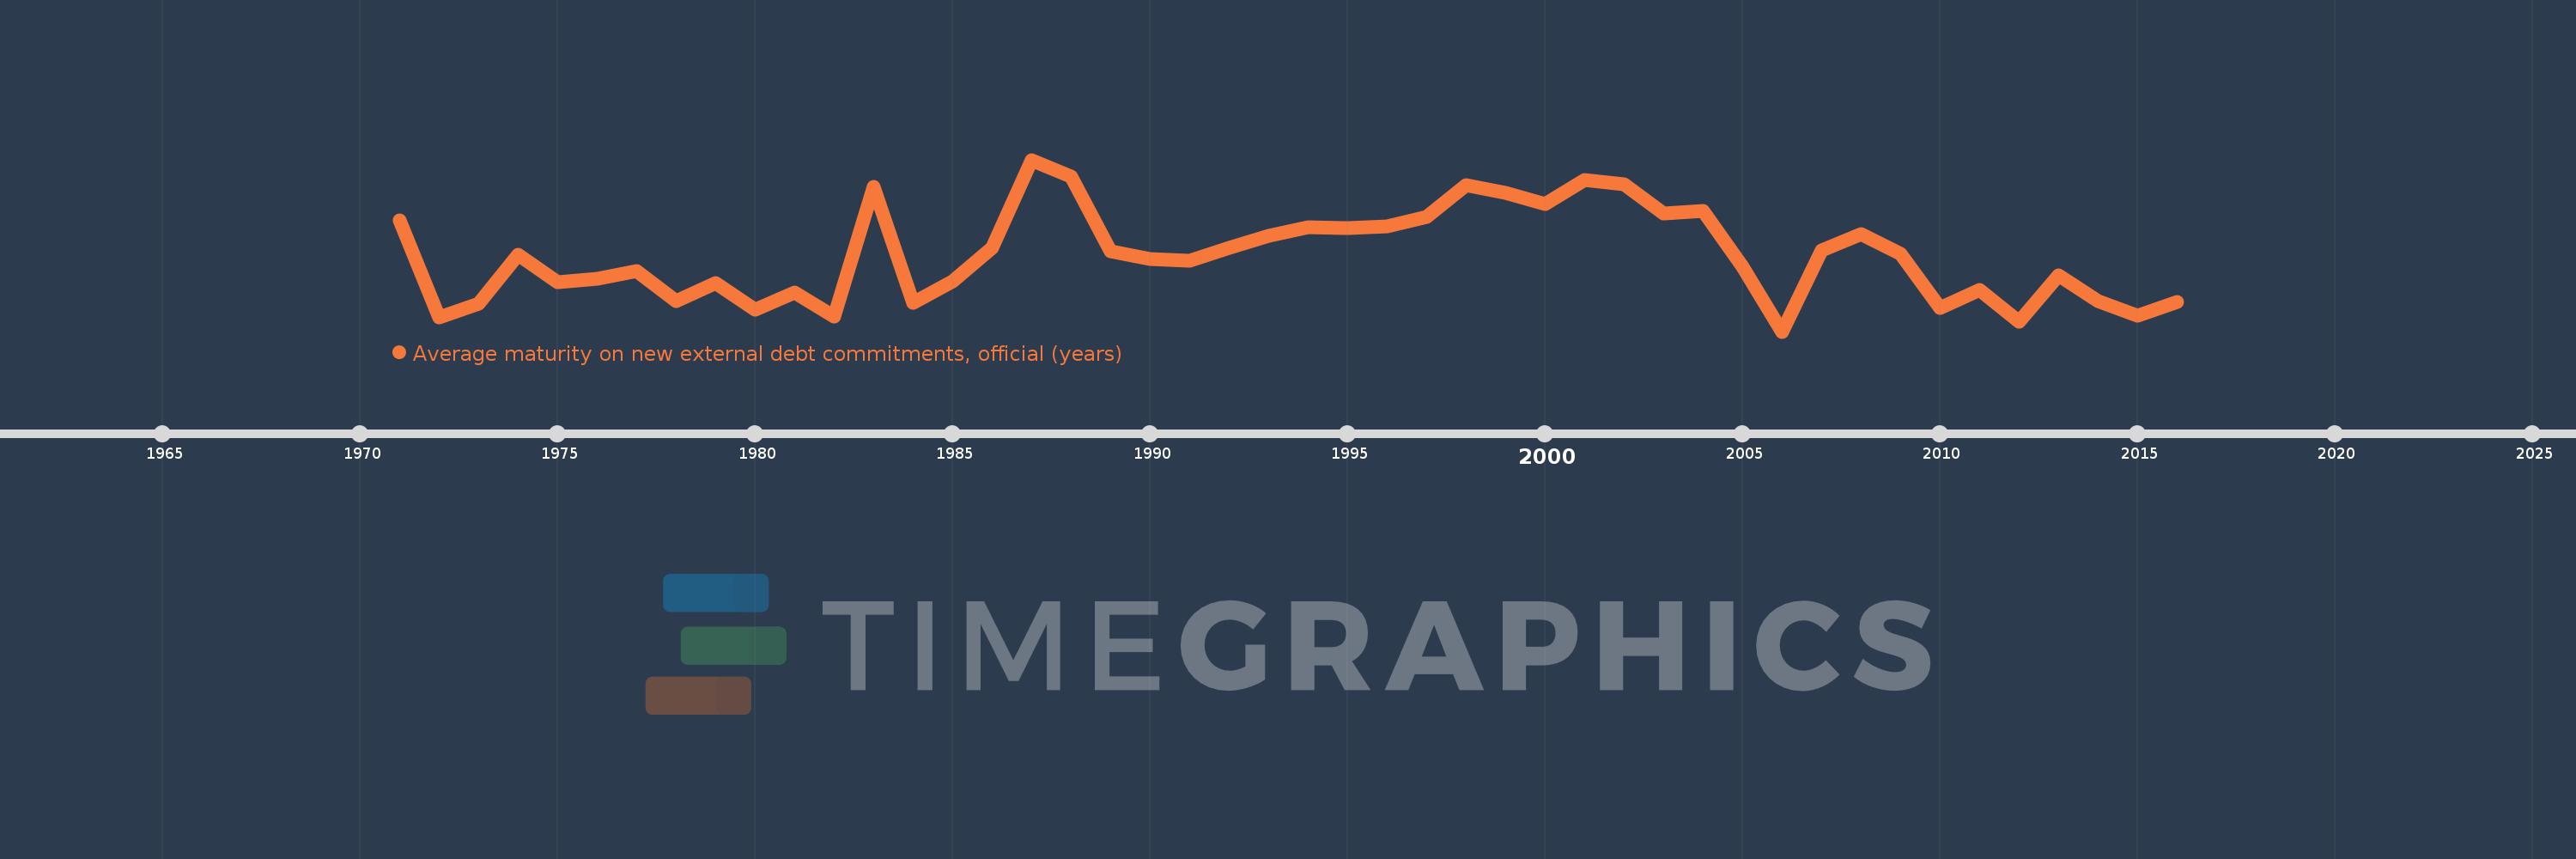
Average maturity on new external debt commitments, official (years)
2016,2015,2014,2013,2012,2011,2010,2009,2008,2007,2006,2005,2004,2003,2002,2001,2000,1999,1998,1997,1996,1995,1994,1993,1992,1991,1990,1989,1988,1987,1986,1985,1984,1983,1982,1981,1980,1979,1978,1977,1976,1975,1974,1973,1972,1971
Estas estadísticas en otros países:
línea de tiempo (timeline):
En esta escala de tiempo se presenta un gráfico de 1971 y 2016 de Sub-Saharan Africa (excluding high income). Los datos de 1970 están ausentes. El número de observaciones reales por fecha: 46.
Fuente (nombre):
Indicadores del desarrollo mundial
Fuente (organización):
World Bank, International Debt Statistics.
Categorías:
External Debt
Se ha actualizado:
23 abr 2017 año
Los indicadores de los cambios de valor en los últimos años
Mínimo:
21.458
1 ene 2006 año
Máximo:
38.244
1 ene 1987 año
A la fecha de observación
Valor
Cambio absoluto
El cambio con respecto al valor anterior
1 ene 1971 año
32.296
+32.296
0.0%
1 ene 1972 año
22.863
-9.434
-29.21%
1 ene 1973 año
24.218
+1.355
5.93%
1 ene 1974 año
28.982
+4.763
19.67%
1 ene 1975 año
26.288
-2.693
-9.29%
1 ene 1976 año
26.643
+0.355
1.35%
1 ene 1977 año
27.37
+0.727
2.73%
1 ene 1978 año
24.419
-2.951
-10.78%
1 ene 1979 año
26.206
+1.788
7.32%
1 ene 1980 año
23.584
-2.622
-10.01%
1 ene 1981 año
25.276
+1.692
7.18%
1 ene 1982 año
22.945
-2.331
-9.22%
1 ene 1983 año
35.634
+12.69
55.31%
1 ene 1984 año
24.247
-11.387
-31.96%
1 ene 1985 año
26.387
+2.14
8.83%
1 ene 1986 año
29.629
+3.242
12.29%
1 ene 1987 año
38.244
+8.615
29.08%
1 ene 1988 año
36.595
-1.649
-4.31%
1 ene 1989 año
29.315
-7.28
-19.89%
1 ene 1990 año
28.556
-0.759
-2.59%
1 ene 1991 año
28.345
-0.21
-0.74%
1 ene 1992 año
29.658
+1.312
4.63%
1 ene 1993 año
30.812
+1.154
3.89%
1 ene 1994 año
31.679
+0.866
2.81%
1 ene 1995 año
31.592
-0.086
-0.27%
1 ene 1996 año
31.735
+0.143
0.45%
1 ene 1997 año
32.668
+0.933
2.94%
1 ene 1998 año
35.784
+3.116
9.54%
1 ene 1999 año
35.032
-0.753
-2.1%
1 ene 2000 año
33.902
-1.129
-3.22%
1 ene 2001 año
36.279
+2.376
7.01%
1 ene 2002 año
35.84
-0.439
-1.21%
1 ene 2003 año
33.002
-2.838
-7.92%
1 ene 2004 año
33.266
+0.263
0.8%
1 ene 2005 año
27.82
-5.445
-16.37%
1 ene 2006 año
21.458
-6.362
-22.87%
1 ene 2007 año
29.417
+7.959
37.09%
1 ene 2008 año
31.001
+1.584
5.38%
1 ene 2009 año
29.095
-1.906
-6.15%
1 ene 2010 año
23.768
-5.328
-18.31%
1 ene 2011 año
25.561
+1.794
7.55%
1 ene 2012 año
22.391
-3.17
-12.4%
1 ene 2013 año
26.917
+4.526
20.21%
1 ene 2014 año
24.411
-2.506
-9.31%
1 ene 2015 año
23.046
-1.365
-5.59%
1 ene 2016 año
24.335
+1.289
5.59%
Ranking de los países por los datos estadísticos actuales


Comentarios: