29
/es/
es
AIzaSyAYiBZKx7MnpbEhh9jyipgxe19OcubqV5w
April 1, 2024
58342
South Asia (IDA & IBRD)
TSA
false
2
1
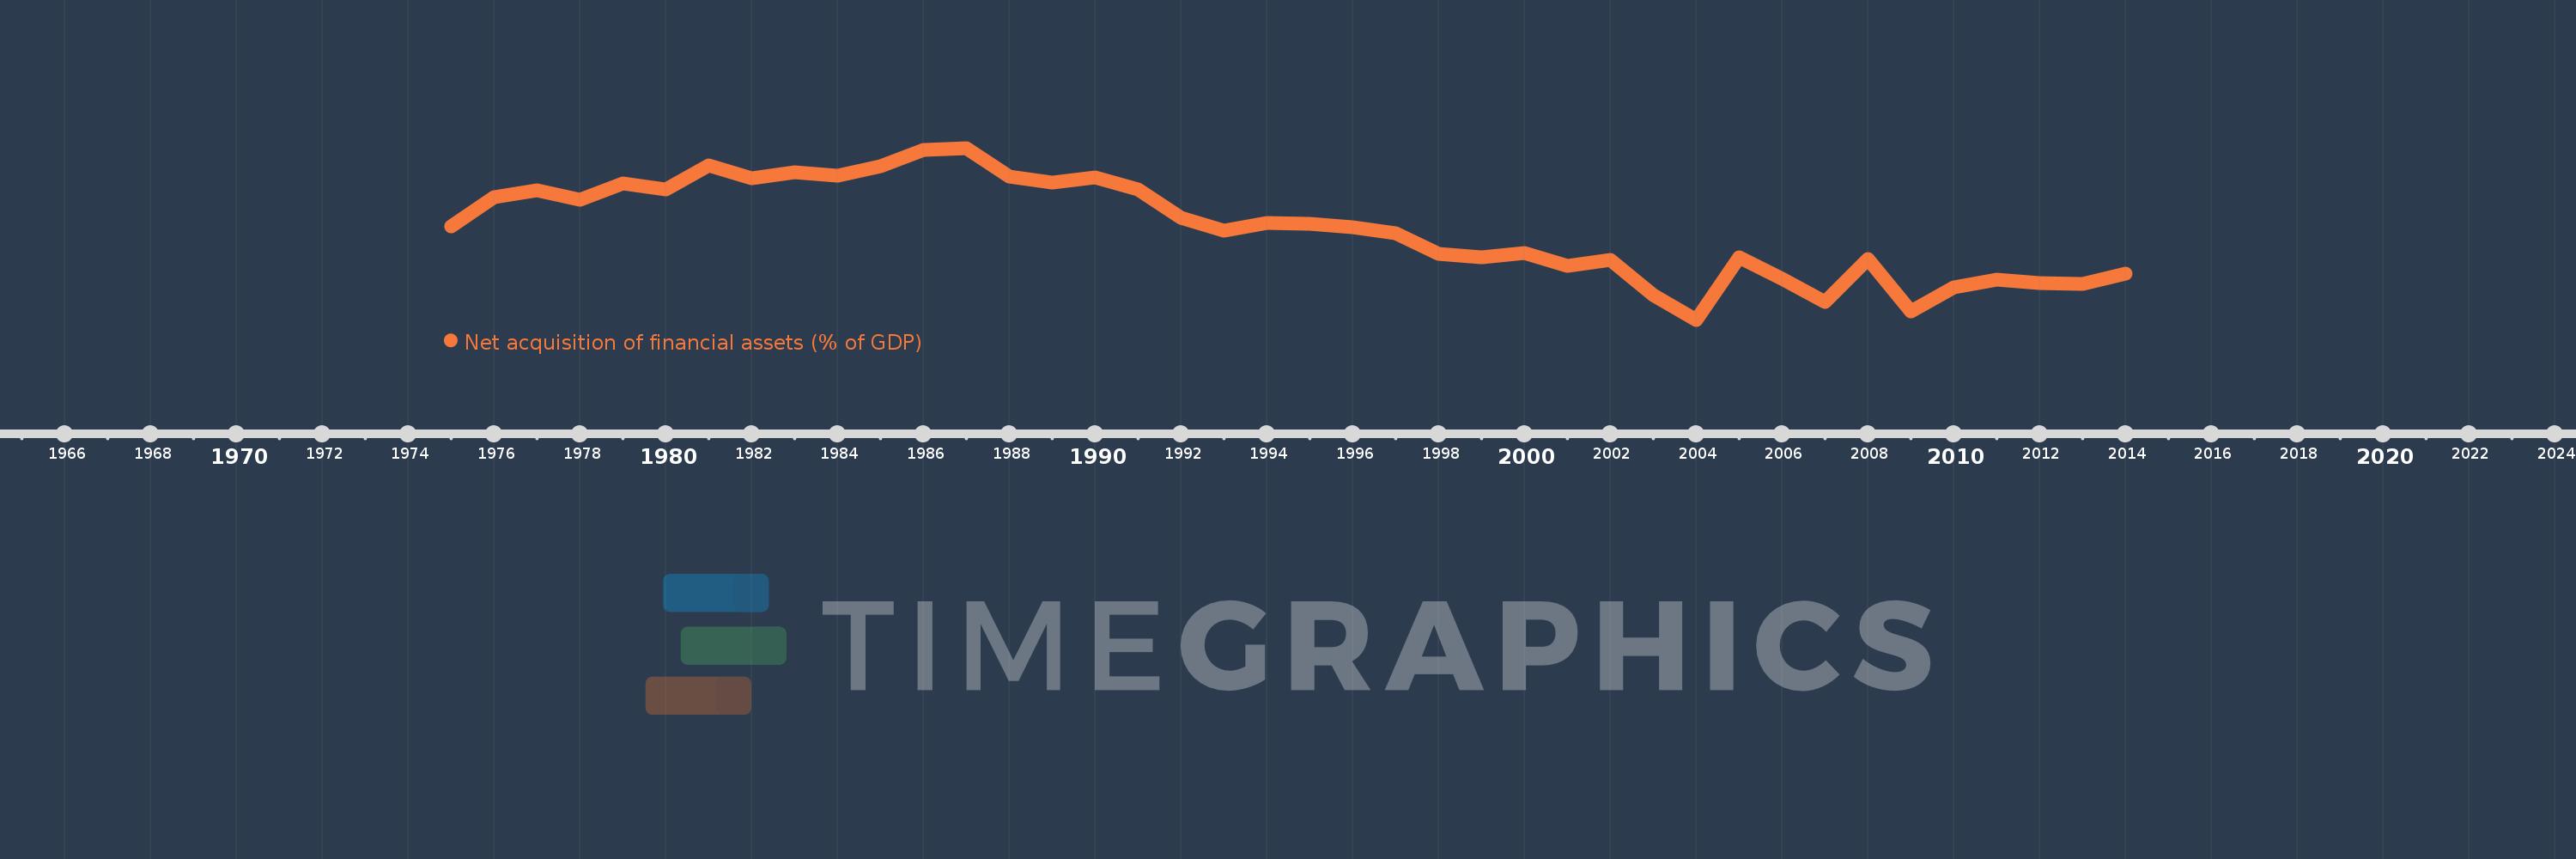
Net acquisition of financial assets (% of GDP)
2014,2013,2012,2011,2010,2009,2008,2007,2006,2005,2004,2003,2002,2001,2000,1999,1998,1997,1996,1995,1994,1993,1992,1991,1990,1989,1988,1987,1986,1985,1984,1983,1982,1981,1980,1979,1978,1977,1976,1975
Estas estadísticas en otros países:
línea de tiempo (timeline):
En esta escala de tiempo se presenta un gráfico de 1975 y 2014 de South Asia (IDA & IBRD). Los datos de 1974 están ausentes. El número de observaciones reales por fecha: 40.
Fuente (nombre):
Indicadores del desarrollo mundial
Fuente (organización):
International Monetary Fund, Government Finance Statistics Yearbook and data files.
Categorías:
Public Sector
Se ha actualizado:
23 abr 2017 año
Los indicadores de los cambios de valor en los últimos años
Mínimo:
-0.348
1 ene 2004 año
Máximo:
5.524
1 ene 1987 año
A la fecha de observación
Valor
Cambio absoluto
El cambio con respecto al valor anterior
1 ene 1975 año
2.838
+2.838
0.0%
1 ene 1976 año
3.835
+0.997
35.14%
1 ene 1977 año
4.073
+0.238
6.21%
1 ene 1978 año
3.765
-0.308
-7.56%
1 ene 1979 año
4.325
+0.56
14.87%
1 ene 1980 año
4.118
-0.207
-4.79%
1 ene 1981 año
4.936
+0.819
19.89%
1 ene 1982 año
4.474
-0.463
-9.37%
1 ene 1983 año
4.686
+0.212
4.74%
1 ene 1984 año
4.565
-0.121
-2.57%
1 ene 1985 año
4.884
+0.319
6.99%
1 ene 1986 año
5.453
+0.569
11.65%
1 ene 1987 año
5.524
+0.071
1.3%
1 ene 1988 año
4.547
-0.977
-17.68%
1 ene 1989 año
4.327
-0.22
-4.84%
1 ene 1990 año
4.51
+0.183
4.22%
1 ene 1991 año
4.11
-0.4
-8.87%
1 ene 1992 año
3.132
-0.978
-23.8%
1 ene 1993 año
2.702
-0.43
-13.72%
1 ene 1994 año
2.972
+0.27
9.98%
1 ene 1995 año
2.93
-0.042
-1.41%
1 ene 1996 año
2.8
-0.13
-4.44%
1 ene 1997 año
2.62
-0.18
-6.42%
1 ene 1998 año
1.9
-0.72
-27.48%
1 ene 1999 año
1.778
-0.121
-6.39%
1 ene 2000 año
1.92
+0.142
7.98%
1 ene 2001 año
1.491
-0.429
-22.36%
1 ene 2002 año
1.69
+0.199
13.38%
1 ene 2003 año
0.493
-1.198
-70.85%
1 ene 2004 año
-0.348
-0.84
-170.54%
1 ene 2005 año
1.78
+2.128
-612.21%
1 ene 2006 año
1.062
-0.719
-40.36%
1 ene 2007 año
0.268
-0.793
-74.71%
1 ene 2008 año
1.714
+1.446
538.53%
1 ene 2009 año
-0.059
-1.773
-103.42%
1 ene 2010 año
0.772
+0.83
-1.42 mil%
1 ene 2011 año
1.028
+0.256
33.12%
1 ene 2012 año
0.9
-0.127
-12.39%
1 ene 2013 año
0.883
-0.017
-1.94%
1 ene 2014 año
1.228
+0.345
39.12%
Ranking de los países por los datos estadísticos actuales


Comentarios: