29
/es/
es
AIzaSyAYiBZKx7MnpbEhh9jyipgxe19OcubqV5w
April 1, 2024
57639
South Asia
SAS
false
2
1
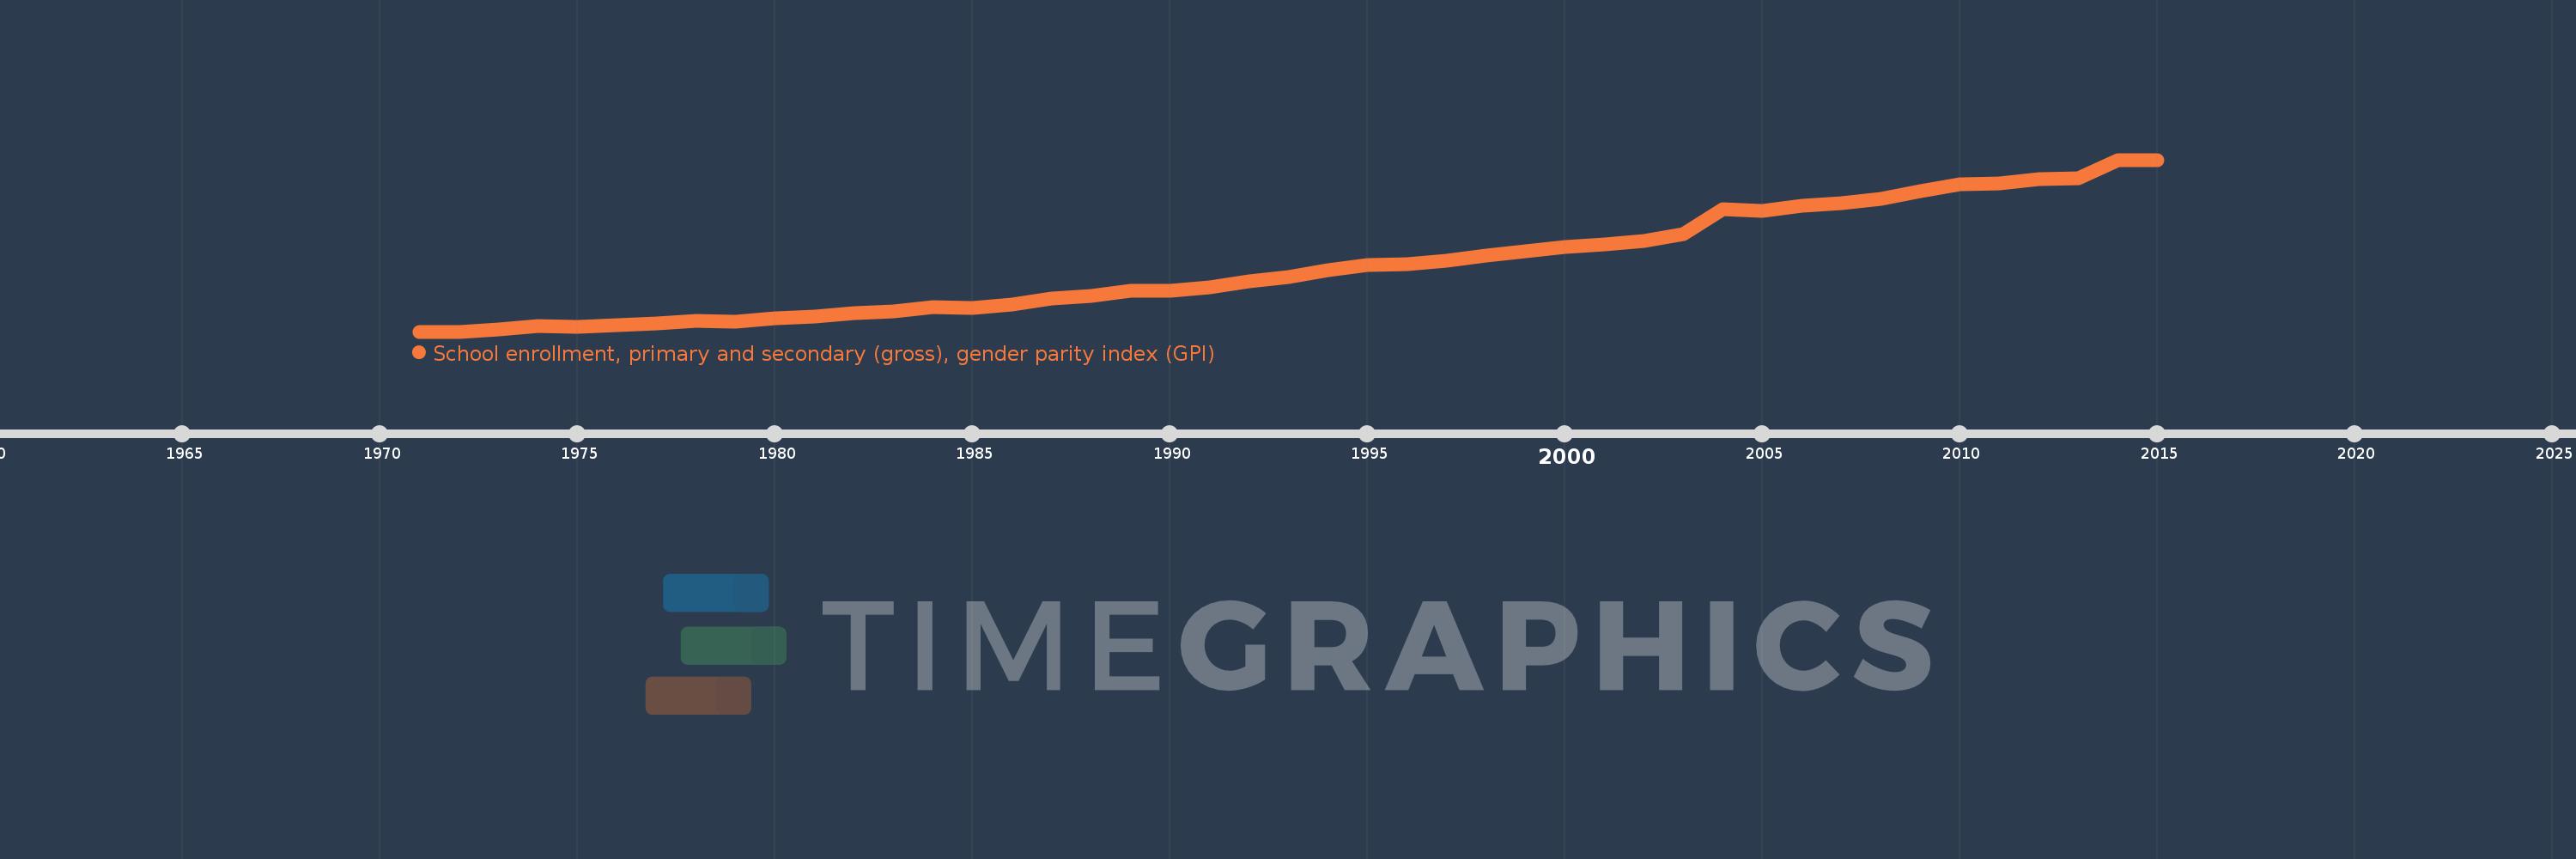
School enrollment, primary and secondary (gross), gender parity index (GPI)
2015,2014,2013,2012,2011,2010,2009,2008,2007,2006,2005,2004,2003,2002,2001,2000,1999,1998,1997,1996,1995,1994,1993,1992,1991,1990,1989,1988,1987,1986,1985,1984,1983,1982,1981,1980,1979,1978,1977,1976,1975,1974,1973,1972,1971
Estas estadísticas en otros países:
AfghanistanAlbaniaAlgeriaAndorraAngolaAntigua and BarbudaArab WorldArgentinaArmeniaArubaAustraliaAustriaAzerbaijanBahamas, TheBahrainBangladeshBarbadosBelarusBelgiumBelizeBeninBermudaBhutanBoliviaBosnia and HerzegovinaBotswanaBrazilBrunei DarussalamBulgariaBurkina FasoBurundiCabo VerdeCambodiaCameroonCanadaCaribbean small statesCentral African RepublicCentral Europe and the BalticsChadChileChinaColombiaComorosCongo, Dem. Rep.Congo, Rep.Costa RicaCote d'IvoireCroatiaCubaCuracaoCyprusCzech RepublicDenmarkDjiboutiDominicaDominican RepublicEarly-demographic dividendEast Asia & PacificEast Asia & Pacific (excluding high income)East Asia & Pacific (IDA & IBRD countries)EcuadorEgypt, Arab Rep.El SalvadorEquatorial GuineaEritreaEstoniaEthiopiaEuro areaEurope & Central AsiaEurope & Central Asia (excluding high income)Europe & Central Asia (IDA & IBRD countries)European UnionFijiFinlandFragile and conflict affected situationsFranceGabonGambia, TheGeorgiaGermanyGhanaGreeceGrenadaGuatemalaGuineaGuinea-BissauGuyanaHeavily indebted poor countries (HIPC)High incomeHondurasHong Kong SAR, ChinaHungaryIBRD onlyIcelandIDA & IBRD totalIDA blendIDA onlyIDA totalIndiaIndonesiaIran, Islamic Rep.IraqIrelandIsraelItalyJamaicaJapanJordanKazakhstanKenyaKiribatiKorea, Dem. People’s Rep.Korea, Rep.KuwaitKyrgyz RepublicLao PDRLate-demographic dividendLatin America & Caribbean Latin America & Caribbean (excluding high income)Latin America & the Caribbean (IDA & IBRD countries)LatviaLeast developed countries: UN classificationLebanonLesothoLiberiaLibyaLiechtensteinLithuaniaLow & middle incomeLow incomeLower middle incomeLuxembourgMacao SAR, ChinaMacedonia, FYRMadagascarMalawiMaldivesMaliMaltaMarshall IslandsMauritaniaMauritiusMexicoMicronesia, Fed. Sts.Middle East & North AfricaMiddle East & North Africa (excluding high income)Middle East & North Africa (IDA & IBRD countries)Middle incomeMoldovaMongoliaMontenegroMoroccoMozambiqueMyanmarNamibiaNauruNepalNetherlandsNew ZealandNicaraguaNigerNigeriaNorth AmericaNorwayOECD membersOmanOther small statesPacific island small statesPakistanPalauPanamaPapua New GuineaParaguayPeruPhilippinesPolandPortugalPost-demographic dividendPre-demographic dividendPuerto RicoQatarRomaniaRussian FederationRwandaSamoaSan MarinoSao Tome and PrincipeSaudi ArabiaSenegalSerbiaSeychellesSierra LeoneSlovak RepublicSloveniaSmall statesSolomon IslandsSomaliaSouth AfricaSouth AsiaSouth Asia (IDA & IBRD)SpainSri LankaSt. Kitts and NevisSt. LuciaSt. Vincent and the GrenadinesSub-Saharan Africa Sub-Saharan Africa (excluding high income)Sub-Saharan Africa (IDA & IBRD countries)SudanSurinameSwazilandSwedenSwitzerlandSyrian Arab RepublicTajikistanTanzaniaThailandTimor-LesteTogoTongaTrinidad and TobagoTunisiaTurkeyTurkmenistanTuvaluUgandaUkraineUnited Arab EmiratesUnited KingdomUnited StatesUpper middle incomeUruguayUzbekistanVanuatuVenezuela, RBVietnamWest Bank and GazaWorldYemen, Rep.ZambiaZimbabwe línea de tiempo (timeline):
En esta escala de tiempo se presenta un gráfico de 1971 y 2015 de South Asia. Los datos de 1970 están ausentes. El número de observaciones reales por fecha: 45.
Fuente (nombre):
Indicadores del desarrollo mundial
Fuente (organización):
United Nations Educational, Scientific, and Cultural Organization (UNESCO) Institute for Statistics.
Categorías:
Aid Effectiveness, Climate Change, Education, Gender, Social Development
Se ha actualizado:
23 abr 2017 año
Los indicadores de los cambios de valor en los últimos años
Mínimo:
0.553
1 ene 1971 año
Máximo:
1.028
1 ene 2015 año
A la fecha de observación
Valor
Cambio absoluto
El cambio con respecto al valor anterior
1 ene 1971 año
0.553
+0.553
0.0%
1 ene 1972 año
0.553
+0.0
0.03%
1 ene 1973 año
0.56
+0.007
1.29%
1 ene 1974 año
0.568
+0.008
1.49%
1 ene 1975 año
0.567
-0.002
-0.27%
1 ene 1976 año
0.572
+0.005
0.88%
1 ene 1977 año
0.576
+0.004
0.77%
1 ene 1978 año
0.582
+0.006
1.07%
1 ene 1979 año
0.581
-0.001
-0.23%
1 ene 1980 año
0.589
+0.008
1.36%
1 ene 1981 año
0.594
+0.005
0.8%
1 ene 1982 año
0.604
+0.011
1.8%
1 ene 1983 año
0.608
+0.004
0.66%
1 ene 1984 año
0.621
+0.013
2.17%
1 ene 1985 año
0.618
-0.003
-0.48%
1 ene 1986 año
0.628
+0.01
1.54%
1 ene 1987 año
0.645
+0.017
2.7%
1 ene 1988 año
0.652
+0.007
1.04%
1 ene 1989 año
0.667
+0.016
2.4%
1 ene 1990 año
0.666
-0.002
-0.25%
1 ene 1991 año
0.676
+0.011
1.61%
1 ene 1992 año
0.693
+0.017
2.49%
1 ene 1993 año
0.703
+0.01
1.47%
1 ene 1994 año
0.723
+0.02
2.86%
1 ene 1995 año
0.736
+0.013
1.76%
1 ene 1996 año
0.74
+0.004
0.58%
1 ene 1997 año
0.749
+0.009
1.21%
1 ene 1998 año
0.763
+0.013
1.78%
1 ene 1999 año
0.775
+0.012
1.63%
1 ene 2000 año
0.788
+0.012
1.58%
1 ene 2001 año
0.795
+0.007
0.94%
1 ene 2002 año
0.804
+0.01
1.2%
1 ene 2003 año
0.823
+0.018
2.26%
1 ene 2004 año
0.892
+0.069
8.4%
1 ene 2005 año
0.886
-0.005
-0.61%
1 ene 2006 año
0.901
+0.015
1.64%
1 ene 2007 año
0.909
+0.008
0.89%
1 ene 2008 año
0.921
+0.012
1.29%
1 ene 2009 año
0.941
+0.021
2.26%
1 ene 2010 año
0.961
+0.019
2.03%
1 ene 2011 año
0.963
+0.002
0.26%
1 ene 2012 año
0.974
+0.011
1.11%
1 ene 2013 año
0.978
+0.004
0.46%
1 ene 2014 año
1.028
+0.049
5.06%
1 ene 2015 año
1.028
+0.001
0.07%
Ranking de los países por los datos estadísticos actuales


Comentarios: