29
/es/
es
AIzaSyAYiBZKx7MnpbEhh9jyipgxe19OcubqV5w
April 1, 2024
57327
South Asia
SAS
false
2
1
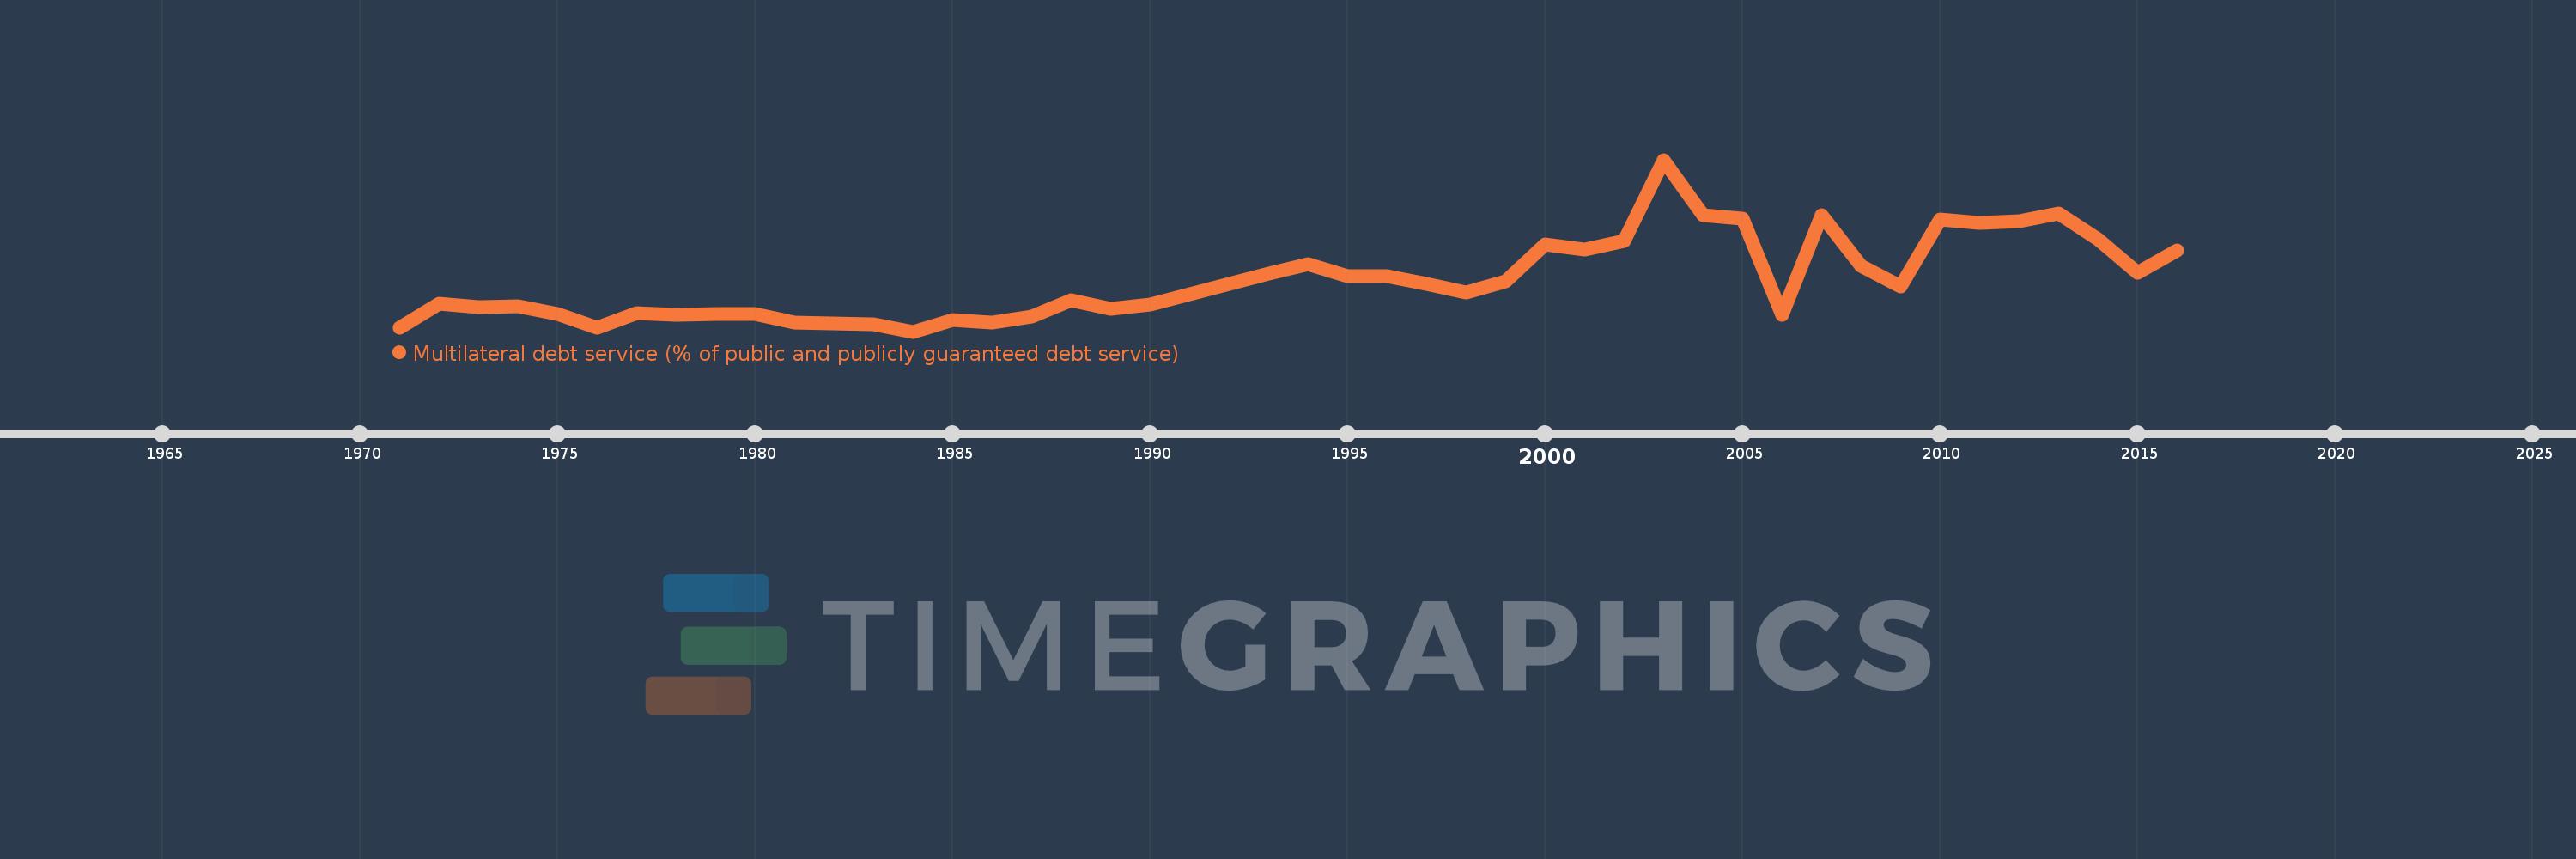
Multilateral debt service (% of public and publicly guaranteed debt service)
2016,2015,2014,2013,2012,2011,2010,2009,2008,2007,2006,2005,2004,2003,2002,2001,2000,1999,1998,1997,1996,1995,1994,1993,1992,1991,1990,1989,1988,1987,1986,1985,1984,1983,1982,1981,1980,1979,1978,1977,1976,1975,1974,1973,1972,1971
Estas estadísticas en otros países:
línea de tiempo (timeline):
En esta escala de tiempo se presenta un gráfico de 1971 y 2016 de South Asia. Los datos de 1970 están ausentes. El número de observaciones reales por fecha: 46.
Fuente (nombre):
Indicadores del desarrollo mundial
Fuente (organización):
World Bank, International Debt Statistics.
Categorías:
External Debt
Se ha actualizado:
23 abr 2017 año
Los indicadores de los cambios de valor en los últimos años
Mínimo:
12.979
1 ene 1984 año
Máximo:
50.254
1 ene 2003 año
A la fecha de observación
Valor
Cambio absoluto
El cambio con respecto al valor anterior
1 ene 1971 año
13.759
+13.759
0.0%
1 ene 1972 año
19.008
+5.249
38.15%
1 ene 1973 año
18.346
-0.661
-3.48%
1 ene 1974 año
18.45
+0.103
0.56%
1 ene 1975 año
16.735
-1.715
-9.29%
1 ene 1976 año
13.845
-2.89
-17.27%
1 ene 1977 año
17.03
+3.185
23.0%
1 ene 1978 año
16.683
-0.347
-2.04%
1 ene 1979 año
16.754
+0.071
0.43%
1 ene 1980 año
16.766
+0.012
0.07%
1 ene 1981 año
14.892
-1.874
-11.18%
1 ene 1982 año
14.825
-0.067
-0.45%
1 ene 1983 año
14.581
-0.244
-1.65%
1 ene 1984 año
12.979
-1.602
-10.99%
1 ene 1985 año
15.483
+2.504
19.29%
1 ene 1986 año
14.979
-0.504
-3.25%
1 ene 1987 año
16.316
+1.337
8.92%
1 ene 1988 año
19.867
+3.552
21.77%
1 ene 1989 año
17.911
-1.956
-9.85%
1 ene 1990 año
18.777
+0.867
4.84%
1 ene 1991 año
21.146
+2.368
12.61%
1 ene 1992 año
23.29
+2.144
10.14%
1 ene 1993 año
25.518
+2.228
9.57%
1 ene 1994 año
27.564
+2.046
8.02%
1 ene 1995 año
24.978
-2.586
-9.38%
1 ene 1996 año
25.037
+0.059
0.24%
1 ene 1997 año
23.344
-1.693
-6.76%
1 ene 1998 año
21.483
-1.861
-7.97%
1 ene 1999 año
23.92
+2.437
11.34%
1 ene 2000 año
31.931
+8.011
33.49%
1 ene 2001 año
30.689
-1.241
-3.89%
1 ene 2002 año
32.62
+1.931
6.29%
1 ene 2003 año
50.254
+17.634
54.06%
1 ene 2004 año
38.22
-12.034
-23.95%
1 ene 2005 año
37.58
-0.64
-1.67%
1 ene 2006 año
16.523
-21.057
-56.03%
1 ene 2007 año
38.316
+21.793
131.9%
1 ene 2008 año
27.187
-11.129
-29.05%
1 ene 2009 año
22.838
-4.349
-16.0%
1 ene 2010 año
37.243
+14.405
63.08%
1 ene 2011 año
36.548
-0.695
-1.87%
1 ene 2012 año
36.93
+0.382
1.04%
1 ene 2013 año
38.653
+1.723
4.67%
1 ene 2014 año
33.028
-5.625
-14.55%
1 ene 2015 año
25.728
-7.299
-22.1%
1 ene 2016 año
30.526
+4.798
18.65%
Ranking de los países por los datos estadísticos actuales


Comentarios: