29
/es/
es
AIzaSyAYiBZKx7MnpbEhh9jyipgxe19OcubqV5w
April 1, 2024
57124
South Asia
SAS
false
2
1
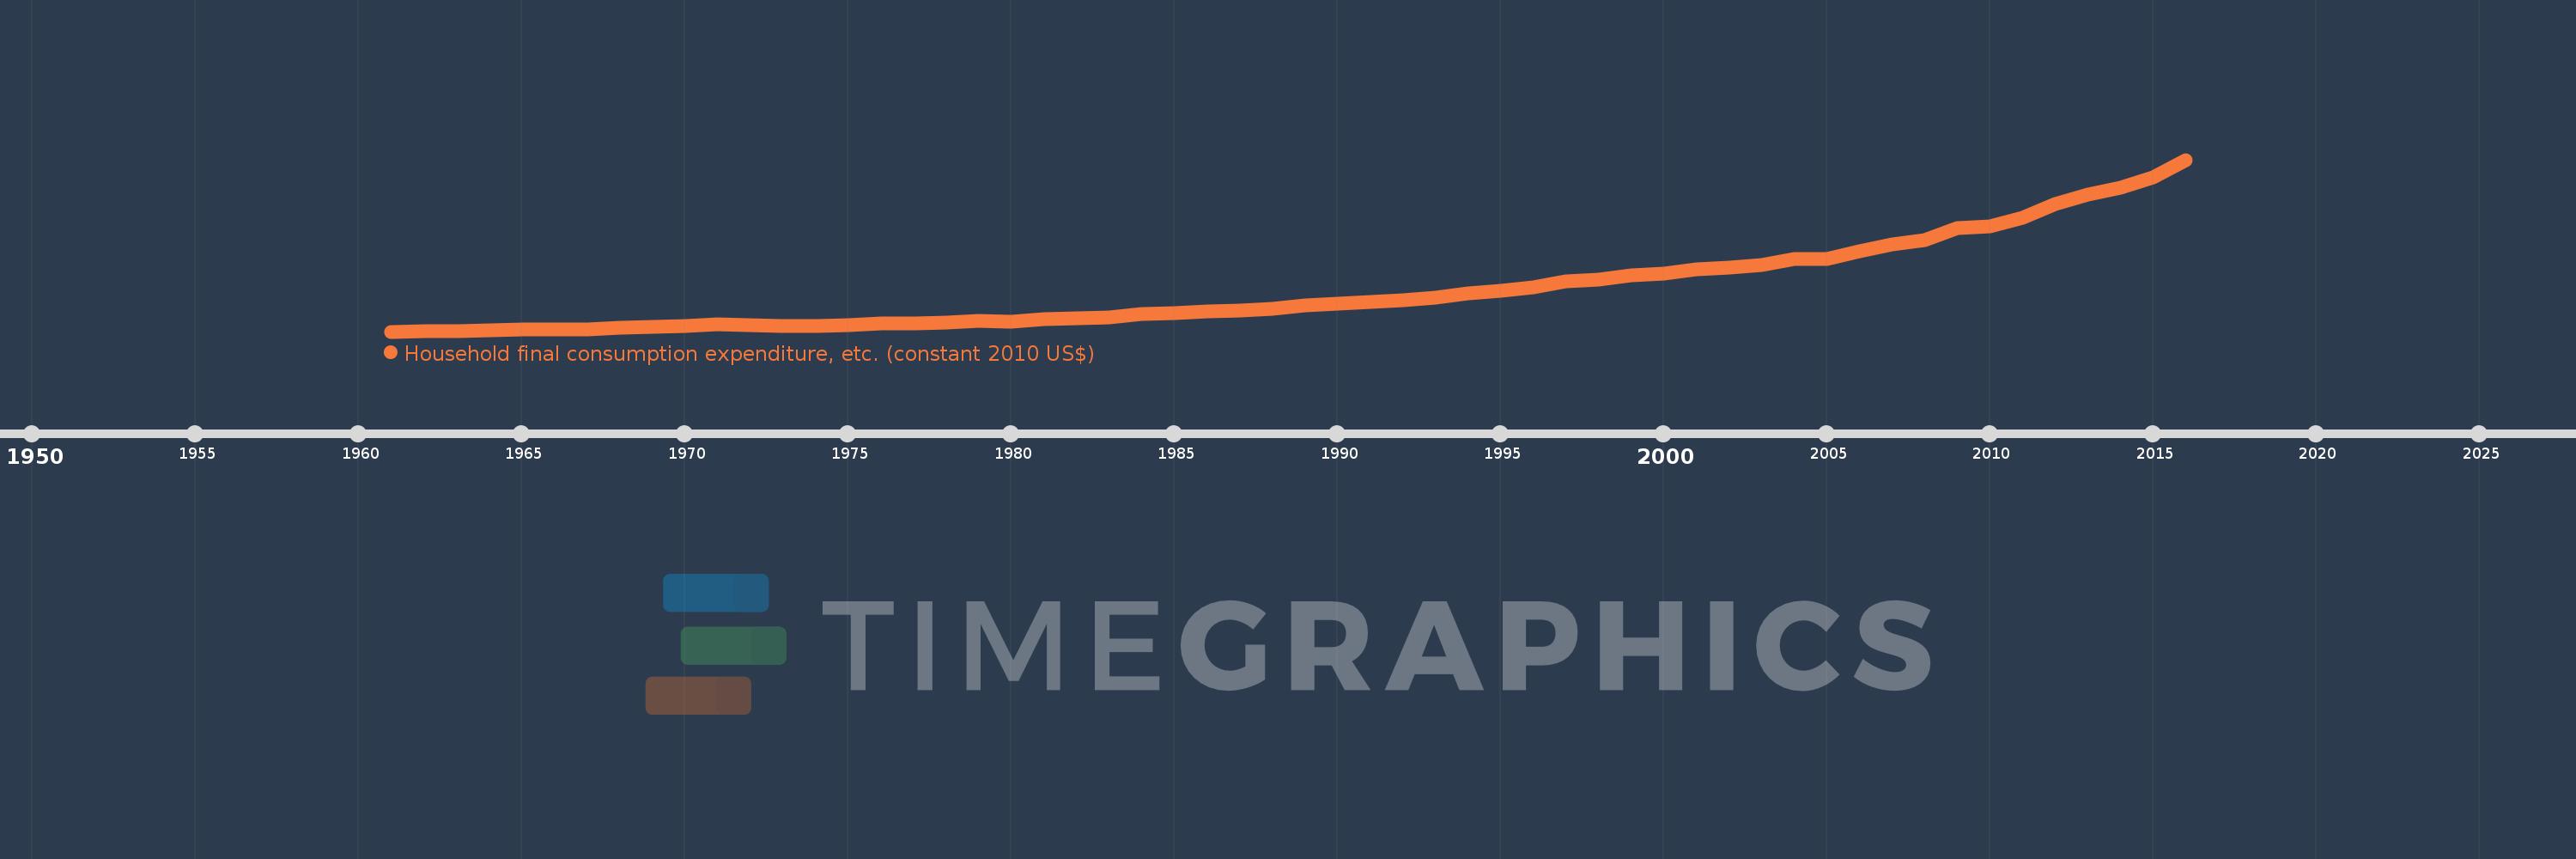
Household final consumption expenditure, etc. (constant 2010 US$)
2016,2015,2014,2013,2012,2011,2010,2009,2008,2007,2006,2005,2004,2003,2002,2001,2000,1999,1998,1997,1996,1995,1994,1993,1992,1991,1990,1989,1988,1987,1986,1985,1984,1983,1982,1981,1980,1979,1978,1977,1976,1975,1974,1973,1972,1971,1970,1969,1968,1967,1966,1965,1964,1963,1962,1961
Estas estadísticas en otros países:
AfghanistanAlbaniaAlgeriaAngolaAntigua and BarbudaArab WorldArgentinaArmeniaArubaAustraliaAustriaAzerbaijanBahamas, TheBahrainBangladeshBarbadosBelarusBelgiumBelizeBeninBermudaBhutanBoliviaBosnia and HerzegovinaBotswanaBrazilBrunei DarussalamBulgariaBurkina FasoBurundiCabo VerdeCambodiaCameroonCanadaCaribbean small statesCentral African RepublicCentral Europe and the BalticsChadChileChinaColombiaComorosCongo, Dem. Rep.Congo, Rep.Cote d'IvoireCroatiaCubaCyprusCzech RepublicDenmarkDominicaDominican RepublicEarly-demographic dividendEast Asia & PacificEast Asia & Pacific (excluding high income)East Asia & Pacific (IDA & IBRD countries)EcuadorEgypt, Arab Rep.El SalvadorEquatorial GuineaEritreaEstoniaEuro areaEurope & Central AsiaEurope & Central Asia (excluding high income)Europe & Central Asia (IDA & IBRD countries)European UnionFaroe IslandsFinlandFragile and conflict affected situationsFranceGabonGambia, TheGeorgiaGermanyGhanaGreeceGrenadaGuatemalaGuineaGuinea-BissauGuyanaHaitiHeavily indebted poor countries (HIPC)High incomeHondurasHong Kong SAR, ChinaHungaryIBRD onlyIcelandIDA & IBRD totalIDA blendIDA onlyIDA totalIndiaIndonesiaIran, Islamic Rep.IraqIrelandIsraelItalyJamaicaJapanJordanKazakhstanKenyaKorea, Rep.KosovoKuwaitKyrgyz RepublicLao PDRLate-demographic dividendLatin America & Caribbean Latin America & Caribbean (excluding high income)Latin America & the Caribbean (IDA & IBRD countries)LatviaLeast developed countries: UN classificationLebanonLiberiaLithuaniaLow & middle incomeLow incomeLower middle incomeLuxembourgMacao SAR, ChinaMacedonia, FYRMadagascarMalawiMalaysiaMaliMaltaMauritaniaMauritiusMexicoMiddle East & North AfricaMiddle East & North Africa (excluding high income)Middle East & North Africa (IDA & IBRD countries)Middle incomeMoldovaMongoliaMontenegroMoroccoMozambiqueNamibiaNepalNetherlandsNew ZealandNicaraguaNigerNigeriaNorth AmericaNorwayOECD membersOmanOther small statesPakistanPanamaParaguayPeruPhilippinesPolandPortugalPost-demographic dividendPre-demographic dividendPuerto RicoQatarRomaniaRussian FederationRwandaSaudi ArabiaSenegalSerbiaSeychellesSierra LeoneSingaporeSlovak RepublicSloveniaSmall statesSouth AfricaSouth AsiaSouth Asia (IDA & IBRD)South SudanSpainSri LankaSt. Kitts and NevisSt. LuciaSt. Vincent and the GrenadinesSub-Saharan Africa Sub-Saharan Africa (excluding high income)Sub-Saharan Africa (IDA & IBRD countries)SudanSurinameSwazilandSwedenSwitzerlandTajikistanTanzaniaThailandTimor-LesteTogoTongaTrinidad and TobagoTunisiaTurkeyTurkmenistanUgandaUkraineUnited Arab EmiratesUnited KingdomUnited StatesUpper middle incomeUruguayUzbekistanVanuatuVenezuela, RBVietnamWest Bank and GazaWorldYemen, Rep.ZambiaZimbabwe línea de tiempo (timeline):
En esta escala de tiempo se presenta un gráfico de 1961 y 2016 de South Asia. Los datos de 1960 están ausentes. El número de observaciones reales por fecha: 56.
Fuente (nombre):
Indicadores del desarrollo mundial
Fuente (organización):
World Bank national accounts data, and OECD National Accounts data files.
Categorías:
Economy & Growth
Se ha actualizado:
23 abr 2017 año
Los indicadores de los cambios de valor en los últimos años
Mínimo:
159.449 bn
1 ene 1961 año
Máximo:
1.689 billones
1 ene 2016 año
A la fecha de observación
Valor
Cambio absoluto
El cambio con respecto al valor anterior
1 ene 1961 año
159.449 bn
+159.449 bn
0.0%
1 ene 1962 año
160.792 bn
+1.343 bn
0.84%
1 ene 1963 año
162.896 bn
+2.104 bn
1.31%
1 ene 1964 año
167.713 bn
+4.816 bn
2.96%
1 ene 1965 año
179.459 bn
+11.747 bn
7.0%
1 ene 1966 año
175.245 bn
-4.215 bn
-2.35%
1 ene 1967 año
178.977 bn
+3.732 bn
2.13%
1 ene 1968 año
191.606 bn
+12.63 bn
7.06%
1 ene 1969 año
197.776 bn
+6.169 bn
3.22%
1 ene 1970 año
206.891 bn
+9.116 bn
4.61%
1 ene 1971 año
222.173 bn
+15.281 bn
7.39%
1 ene 1972 año
216.822 bn
-5.35 bn
-2.41%
1 ene 1973 año
209.169 bn
-7.654 bn
-3.53%
1 ene 1974 año
212.234 bn
+3.065 bn
1.47%
1 ene 1975 año
213.367 bn
+1.133 bn
0.53%
1 ene 1976 año
232.92 bn
+19.553 bn
9.16%
1 ene 1977 año
230.305 bn
-2.615 bn
-1.12%
1 ene 1978 año
242.604 bn
+12.298 bn
5.34%
1 ene 1979 año
255.786 bn
+13.182 bn
5.43%
1 ene 1980 año
248.158 bn
-7.628 bn
-2.98%
1 ene 1981 año
271.369 bn
+23.211 bn
9.35%
1 ene 1982 año
280.239 bn
+8.87 bn
3.27%
1 ene 1983 año
287.576 bn
+7.337 bn
2.62%
1 ene 1984 año
316.232 bn
+28.656 bn
9.96%
1 ene 1985 año
320.19 bn
+3.958 bn
1.25%
1 ene 1986 año
337.847 bn
+17.657 bn
5.51%
1 ene 1987 año
349.511 bn
+11.664 bn
3.45%
1 ene 1988 año
360.634 bn
+11.124 bn
3.18%
1 ene 1989 año
391.276 bn
+30.642 bn
8.5%
1 ene 1990 año
409.227 bn
+17.951 bn
4.59%
1 ene 1991 año
421.197 bn
+11.969 bn
2.92%
1 ene 1992 año
435.345 bn
+14.148 bn
3.36%
1 ene 1993 año
460.929 bn
+25.584 bn
5.88%
1 ene 1994 año
497.236 bn
+36.308 bn
7.88%
1 ene 1995 año
523.79 bn
+26.554 bn
5.34%
1 ene 1996 año
549.646 bn
+25.856 bn
4.94%
1 ene 1997 año
607.169 bn
+57.523 bn
10.47%
1 ene 1998 año
618.51 bn
+11.341 bn
1.87%
1 ene 1999 año
656.72 bn
+38.209 bn
6.18%
1 ene 2000 año
676.078 bn
+19.358 bn
2.95%
1 ene 2001 año
712.328 bn
+36.25 bn
5.36%
1 ene 2002 año
729.481 bn
+17.153 bn
2.41%
1 ene 2003 año
752.878 bn
+23.397 bn
3.21%
1 ene 2004 año
803.738 bn
+50.86 bn
6.76%
1 ene 2005 año
808.232 bn
+4.494 bn
0.56%
1 ene 2006 año
877.327 bn
+69.095 bn
8.55%
1 ene 2007 año
938.248 bn
+60.921 bn
6.94%
1 ene 2008 año
971.273 bn
+33.024 bn
3.52%
1 ene 2009 año
1.079 billones
+107.516 bn
11.07%
1 ene 2010 año
1.098 billones
+19.358 bn
1.79%
1 ene 2011 año
1.17 billones
+71.909 bn
6.55%
1 ene 2012 año
1.295 billones
+124.932 bn
10.68%
1 ene 2013 año
1.383 billones
+88.159 bn
6.81%
1 ene 2014 año
1.444 billones
+61.114 bn
4.42%
1 ene 2015 año
1.532 billones
+87.738 bn
6.07%
1 ene 2016 año
1.689 billones
+157.43 bn
10.28%
Ranking de los países por los datos estadísticos actuales


Comentarios: