29
/es/
es
AIzaSyAYiBZKx7MnpbEhh9jyipgxe19OcubqV5w
April 1, 2024
55294
Pre-demographic dividend
PRE
false
2
1
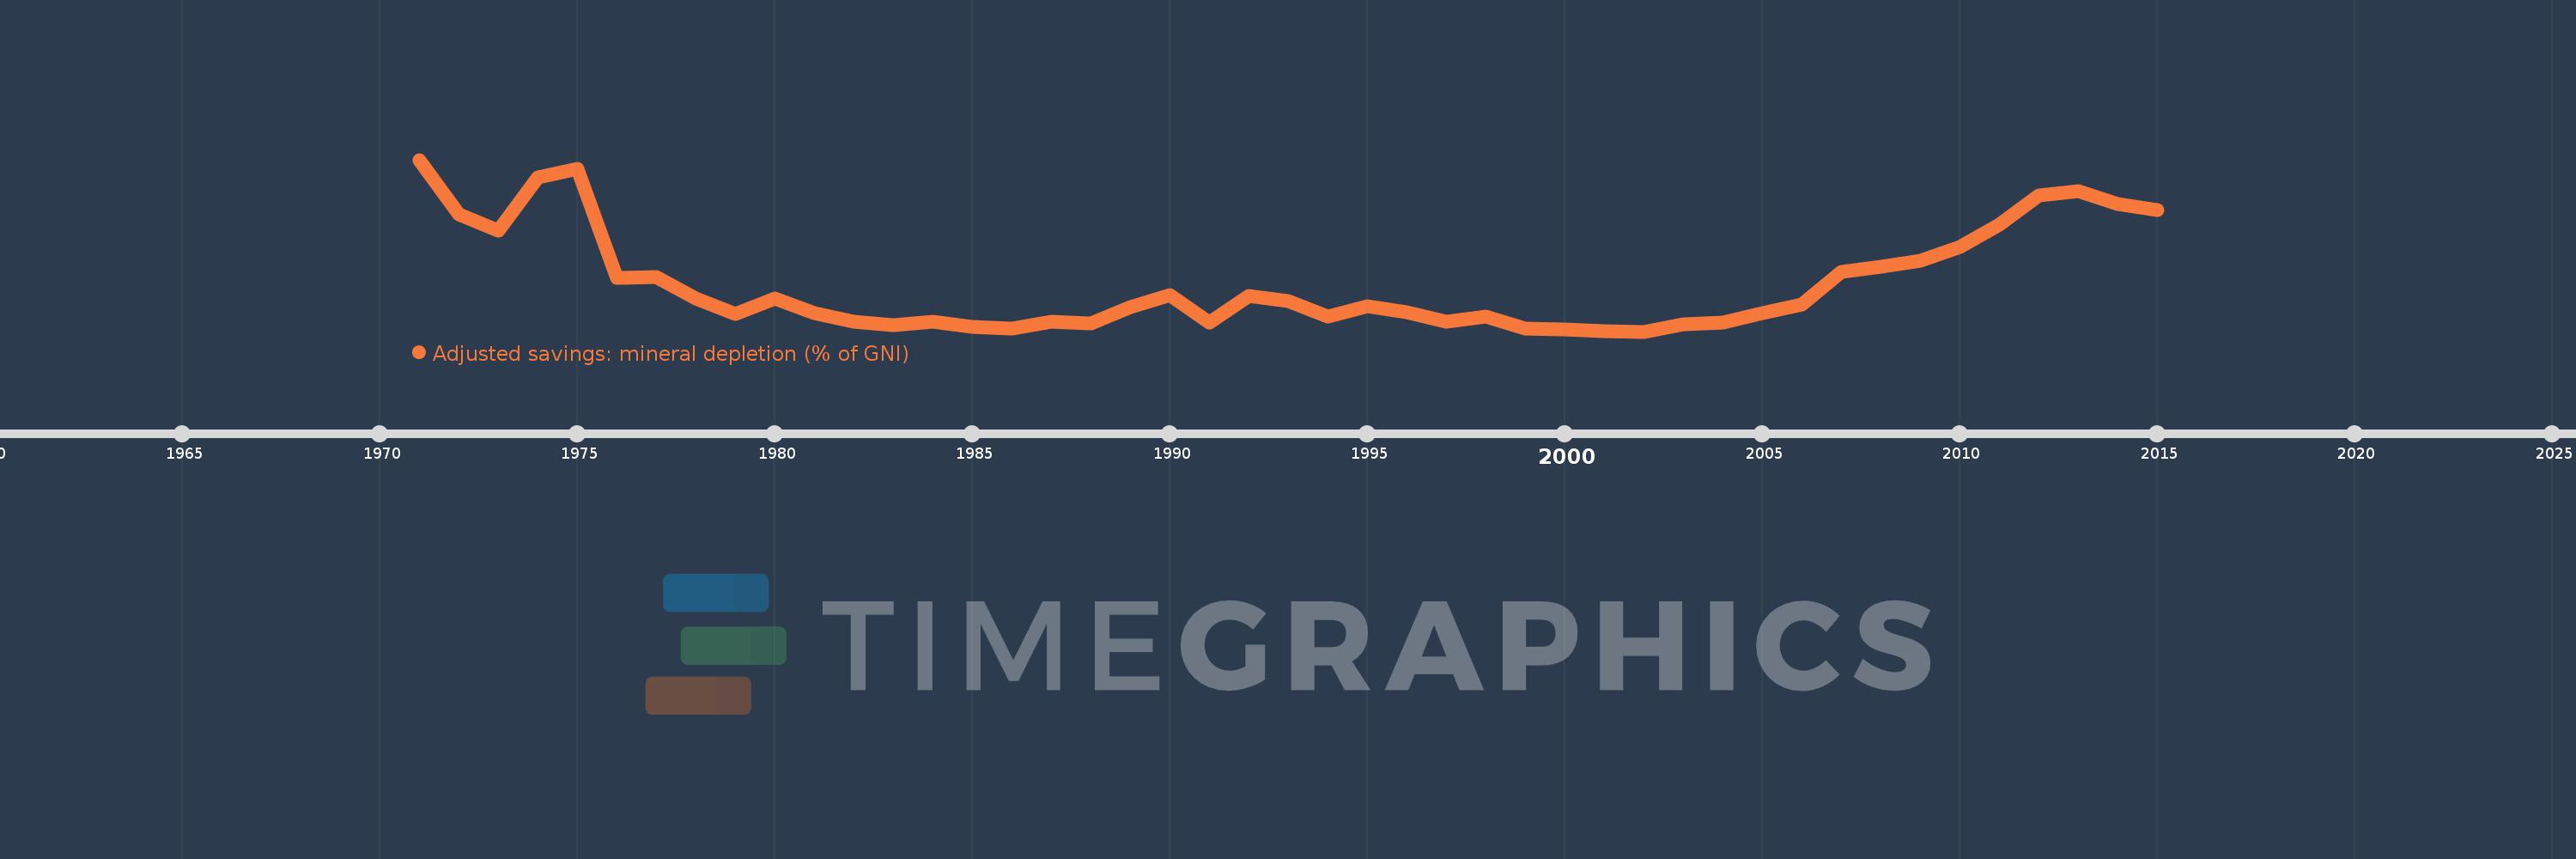
Adjusted savings: mineral depletion (% of GNI)
2015,2014,2013,2012,2011,2010,2009,2008,2007,2006,2005,2004,2003,2002,2001,2000,1999,1998,1997,1996,1995,1994,1993,1992,1991,1990,1989,1988,1987,1986,1985,1984,1983,1982,1981,1980,1979,1978,1977,1976,1975,1974,1973,1972,1971
Estas estadísticas en otros países:
AfghanistanAlbaniaAlgeriaAmerican SamoaAndorraAngolaAntigua and BarbudaArab WorldArgentinaArmeniaAustraliaAustriaAzerbaijanBahamas, TheBahrainBangladeshBarbadosBelarusBelgiumBelizeBeninBermudaBhutanBoliviaBosnia and HerzegovinaBotswanaBrazilBrunei DarussalamBulgariaBurkina FasoBurundiCabo VerdeCambodiaCameroonCanadaCaribbean small statesCentral African RepublicCentral Europe and the BalticsChadChannel IslandsChileChinaColombiaComorosCongo, Dem. Rep.Congo, Rep.Costa RicaCote d'IvoireCroatiaCubaCyprusCzech RepublicDenmarkDjiboutiDominicaDominican RepublicEarly-demographic dividendEast Asia & PacificEast Asia & Pacific (excluding high income)East Asia & Pacific (IDA & IBRD countries)EcuadorEgypt, Arab Rep.El SalvadorEquatorial GuineaEritreaEstoniaEthiopiaEuro areaEurope & Central AsiaEurope & Central Asia (excluding high income)Europe & Central Asia (IDA & IBRD countries)European UnionFaroe IslandsFijiFinlandFragile and conflict affected situationsFranceFrench PolynesiaGabonGambia, TheGeorgiaGermanyGhanaGreeceGreenlandGrenadaGuatemalaGuineaGuinea-BissauGuyanaHaitiHeavily indebted poor countries (HIPC)High incomeHondurasHong Kong SAR, ChinaHungaryIBRD onlyIcelandIDA & IBRD totalIDA blendIDA onlyIDA totalIndiaIndonesiaIran, Islamic Rep.IraqIrelandIsle of ManIsraelItalyJamaicaJapanJordanKazakhstanKenyaKiribatiKorea, Rep.KosovoKuwaitKyrgyz RepublicLao PDRLate-demographic dividendLatin America & Caribbean Latin America & Caribbean (excluding high income)Latin America & the Caribbean (IDA & IBRD countries)LatviaLeast developed countries: UN classificationLebanonLesothoLiberiaLibyaLiechtensteinLithuaniaLow & middle incomeLow incomeLower middle incomeLuxembourgMacao SAR, ChinaMacedonia, FYRMadagascarMalawiMalaysiaMaldivesMaliMaltaMarshall IslandsMauritaniaMauritiusMexicoMicronesia, Fed. Sts.Middle East & North AfricaMiddle East & North Africa (excluding high income)Middle East & North Africa (IDA & IBRD countries)Middle incomeMoldovaMonacoMongoliaMontenegroMoroccoMozambiqueMyanmarNamibiaNepalNetherlandsNew CaledoniaNew ZealandNicaraguaNigerNigeriaNorth AmericaNorwayOECD membersOmanOther small statesPacific island small statesPakistanPalauPanamaPapua New GuineaParaguayPeruPhilippinesPolandPortugalPost-demographic dividendPre-demographic dividendPuerto RicoQatarRomaniaRussian FederationRwandaSamoaSan MarinoSao Tome and PrincipeSaudi ArabiaSenegalSerbiaSeychellesSierra LeoneSingaporeSlovak RepublicSloveniaSmall statesSolomon IslandsSomaliaSouth AfricaSouth AsiaSouth Asia (IDA & IBRD)South SudanSpainSri LankaSt. Kitts and NevisSt. LuciaSt. Vincent and the GrenadinesSub-Saharan Africa Sub-Saharan Africa (excluding high income)Sub-Saharan Africa (IDA & IBRD countries)SudanSurinameSwazilandSwedenSwitzerlandSyrian Arab RepublicTajikistanTanzaniaThailandTimor-LesteTogoTongaTrinidad and TobagoTunisiaTurkeyTurkmenistanTuvaluUgandaUkraineUnited Arab EmiratesUnited KingdomUnited StatesUpper middle incomeUruguayUzbekistanVanuatuVenezuela, RBVietnamVirgin Islands (U.S.)West Bank and GazaWorldYemen, Rep.ZambiaZimbabwe línea de tiempo (timeline):
En esta escala de tiempo se presenta un gráfico de 1971 y 2015 de Pre-demographic dividend. Los datos de 1970 están ausentes. El número de observaciones reales por fecha: 45.
Fuente (nombre):
Indicadores del desarrollo mundial
Fuente (organización):
World Bank staff estimates based on sources and methods in World Bank's "The Changing Wealth of Nations: Measuring Sustainable Development in the New Millennium" (2011).
Categorías:
Economy & Growth, Energy & Mining, Environment
Se ha actualizado:
23 abr 2017 año
Los indicadores de los cambios de valor en los últimos años
Mínimo:
0.099
1 ene 2002 año
Máximo:
1.335
1 ene 1971 año
A la fecha de observación
Valor
Cambio absoluto
El cambio con respecto al valor anterior
1 ene 1971 año
1.335
+1.335
0.0%
1 ene 1972 año
0.943
-0.392
-29.33%
1 ene 1973 año
0.828
-0.115
-12.19%
1 ene 1974 año
1.21
+0.381
46.04%
1 ene 1975 año
1.273
+0.064
5.26%
1 ene 1976 año
0.485
-0.789
-61.95%
1 ene 1977 año
0.492
+0.008
1.6%
1 ene 1978 año
0.334
-0.158
-32.14%
1 ene 1979 año
0.223
-0.111
-33.14%
1 ene 1980 año
0.338
+0.115
51.45%
1 ene 1981 año
0.23
-0.108
-32.07%
1 ene 1982 año
0.17
-0.059
-25.83%
1 ene 1983 año
0.144
-0.027
-15.59%
1 ene 1984 año
0.167
+0.023
16.2%
1 ene 1985 año
0.132
-0.035
-21.23%
1 ene 1986 año
0.122
-0.009
-7.16%
1 ene 1987 año
0.17
+0.048
39.12%
1 ene 1988 año
0.158
-0.012
-7.07%
1 ene 1989 año
0.273
+0.115
72.73%
1 ene 1990 año
0.36
+0.087
31.86%
1 ene 1991 año
0.165
-0.195
-54.07%
1 ene 1992 año
0.355
+0.189
114.46%
1 ene 1993 año
0.317
-0.038
-10.61%
1 ene 1994 año
0.209
-0.108
-34.19%
1 ene 1995 año
0.283
+0.074
35.69%
1 ene 1996 año
0.241
-0.042
-14.76%
1 ene 1997 año
0.171
-0.07
-29.0%
1 ene 1998 año
0.205
+0.033
19.54%
1 ene 1999 año
0.119
-0.085
-41.67%
1 ene 2000 año
0.117
-0.002
-1.8%
1 ene 2001 año
0.103
-0.014
-11.93%
1 ene 2002 año
0.099
-0.004
-3.74%
1 ene 2003 año
0.15
+0.051
51.21%
1 ene 2004 año
0.164
+0.014
9.12%
1 ene 2005 año
0.231
+0.067
40.79%
1 ene 2006 año
0.296
+0.065
28.23%
1 ene 2007 año
0.527
+0.231
78.12%
1 ene 2008 año
0.568
+0.041
7.74%
1 ene 2009 año
0.609
+0.04
7.1%
1 ene 2010 año
0.708
+0.1
16.38%
1 ene 2011 año
0.866
+0.158
22.25%
1 ene 2012 año
1.08
+0.214
24.67%
1 ene 2013 año
1.111
+0.031
2.86%
1 ene 2014 año
1.017
-0.093
-8.39%
1 ene 2015 año
0.973
-0.045
-4.39%
Ranking de los países por los datos estadísticos actuales


Comentarios: