29
/es/
es
AIzaSyAYiBZKx7MnpbEhh9jyipgxe19OcubqV5w
April 1, 2024
54960
Post-demographic dividend
PST
false
2
1
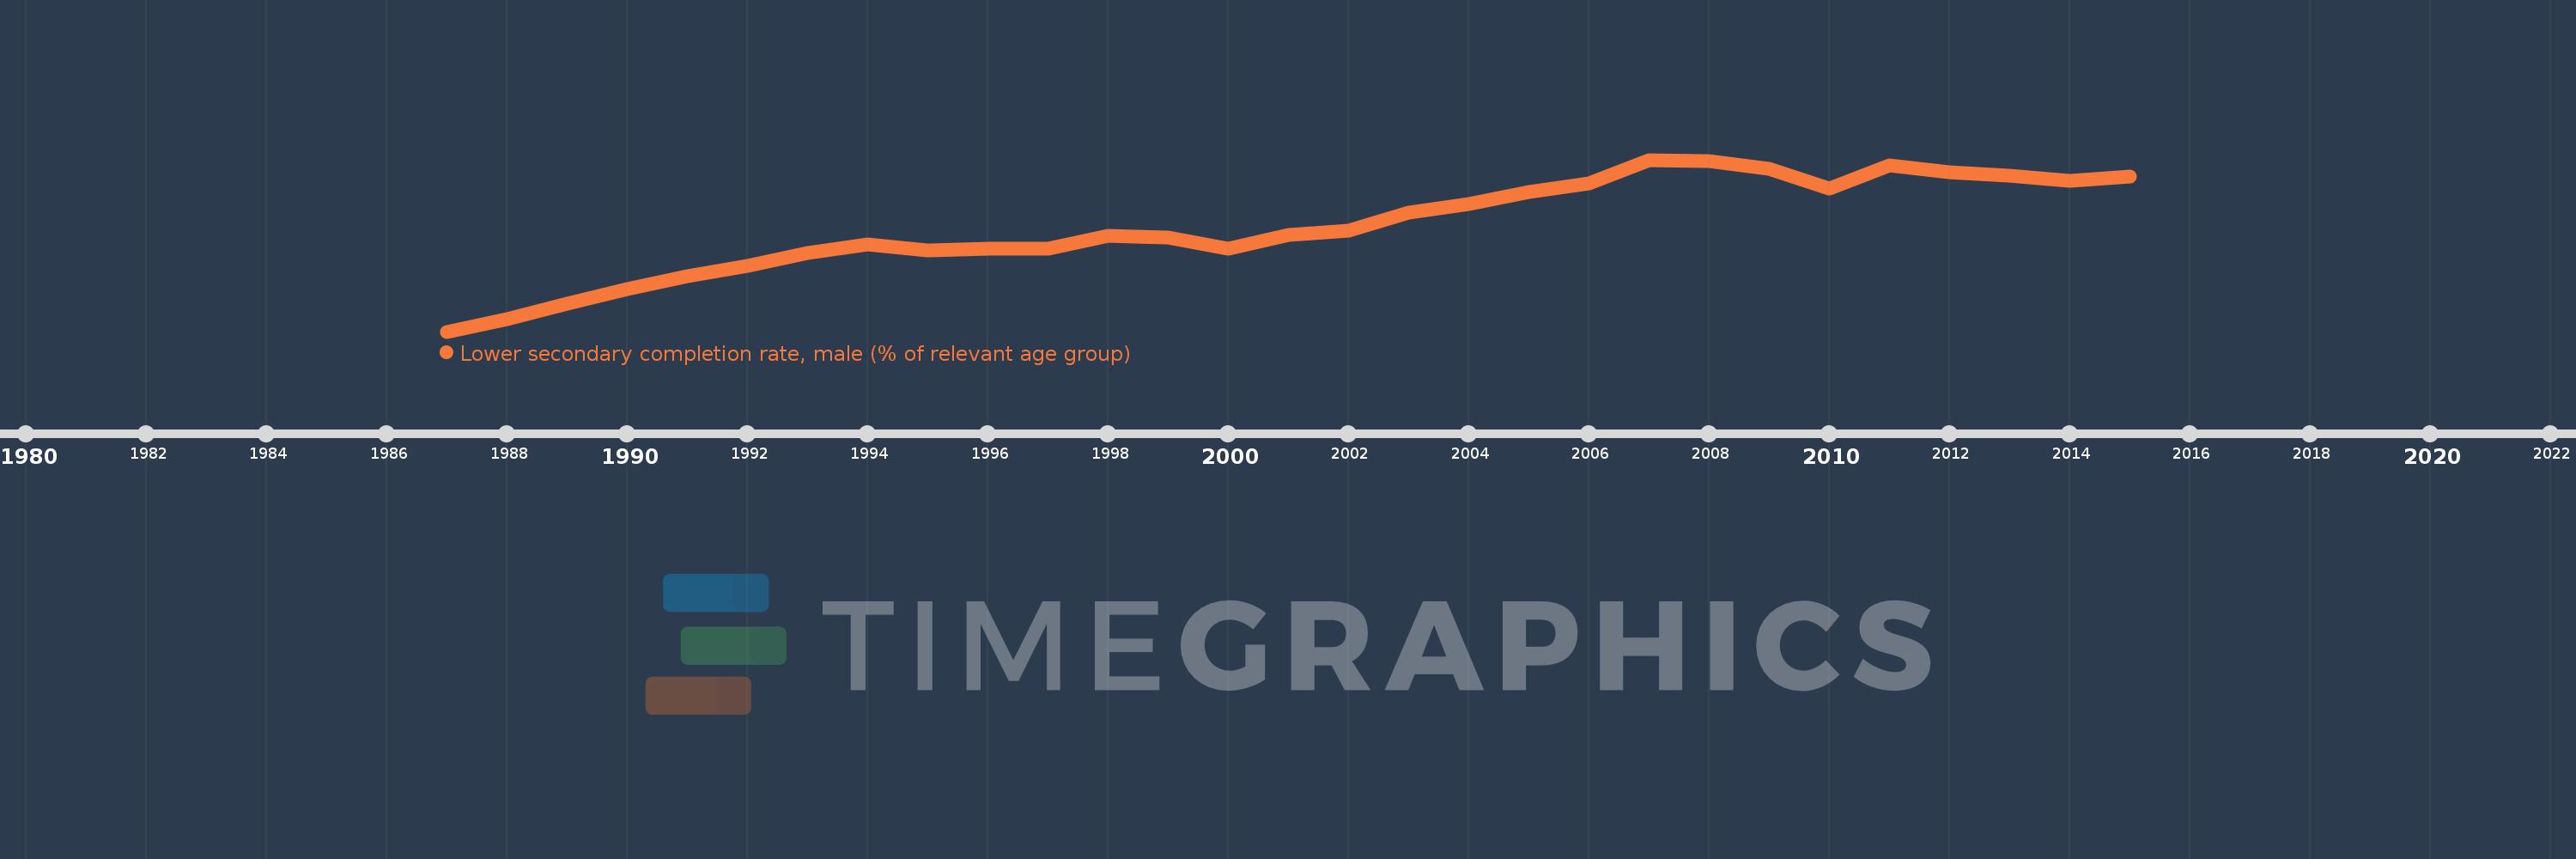
Lower secondary completion rate, male (% of relevant age group)
2015,2014,2013,2012,2011,2010,2009,2008,2007,2006,2005,2004,2003,2002,2001,2000,1999,1998,1997,1996,1995,1994,1993,1992,1991,1990,1989,1988,1987
Estas estadísticas en otros países:
AfghanistanAlbaniaAlgeriaAngolaAntigua and BarbudaArab WorldArgentinaArmeniaArubaAustriaAzerbaijanBahamas, TheBahrainBangladeshBarbadosBelarusBelgiumBelizeBeninBermudaBhutanBoliviaBosnia and HerzegovinaBotswanaBrunei DarussalamBulgariaBurkina FasoBurundiCabo VerdeCambodiaCameroonCaribbean small statesCentral African RepublicCentral Europe and the BalticsChadChileChinaColombiaComorosCongo, Dem. Rep.Congo, Rep.Costa RicaCote d'IvoireCroatiaCubaCyprusCzech RepublicDenmarkDjiboutiDominicaDominican RepublicEarly-demographic dividendEast Asia & PacificEast Asia & Pacific (excluding high income)East Asia & Pacific (IDA & IBRD countries)EcuadorEgypt, Arab Rep.El SalvadorEquatorial GuineaEritreaEstoniaEthiopiaEuro areaEurope & Central AsiaEurope & Central Asia (excluding high income)Europe & Central Asia (IDA & IBRD countries)European UnionFijiFinlandFragile and conflict affected situationsFranceGabonGambia, TheGeorgiaGermanyGhanaGreeceGrenadaGuatemalaGuineaGuinea-BissauGuyanaHaitiHeavily indebted poor countries (HIPC)High incomeHondurasHong Kong SAR, ChinaHungaryIBRD onlyIcelandIDA & IBRD totalIDA blendIDA onlyIDA totalIndiaIndonesiaIran, Islamic Rep.IraqIrelandIsraelItalyJamaicaJapanJordanKazakhstanKenyaKiribatiKorea, Dem. People’s Rep.Korea, Rep.KuwaitKyrgyz RepublicLao PDRLate-demographic dividendLatin America & Caribbean Latin America & Caribbean (excluding high income)Latin America & the Caribbean (IDA & IBRD countries)LatviaLeast developed countries: UN classificationLebanonLesothoLiberiaLiechtensteinLithuaniaLow & middle incomeLow incomeLower middle incomeLuxembourgMacao SAR, ChinaMacedonia, FYRMadagascarMalawiMaldivesMaliMaltaMarshall IslandsMauritaniaMauritiusMexicoMiddle East & North AfricaMiddle East & North Africa (excluding high income)Middle East & North Africa (IDA & IBRD countries)Middle incomeMoldovaMongoliaMontenegroMoroccoMozambiqueMyanmarNamibiaNauruNepalNetherlandsNicaraguaNigerNorwayOECD membersOmanOther small statesPacific island small statesPakistanPalauPanamaPapua New GuineaParaguayPeruPhilippinesPolandPortugalPost-demographic dividendPre-demographic dividendQatarRomaniaRussian FederationRwandaSamoaSan MarinoSao Tome and PrincipeSaudi ArabiaSenegalSerbiaSeychellesSierra LeoneSlovak RepublicSloveniaSmall statesSolomon IslandsSouth AfricaSouth AsiaSouth Asia (IDA & IBRD)South SudanSpainSri LankaSt. Kitts and NevisSt. LuciaSt. Vincent and the GrenadinesSub-Saharan Africa Sub-Saharan Africa (excluding high income)Sub-Saharan Africa (IDA & IBRD countries)SudanSurinameSwazilandSwedenSwitzerlandSyrian Arab RepublicTajikistanTanzaniaThailandTimor-LesteTogoTongaTrinidad and TobagoTunisiaTurkeyTuvaluUgandaUkraineUnited Arab EmiratesUpper middle incomeUruguayUzbekistanVanuatuVenezuela, RBVietnamWest Bank and GazaWorldYemen, Rep.ZambiaZimbabwe línea de tiempo (timeline):
En esta escala de tiempo se presenta un gráfico de 1987 y 2015 de Post-demographic dividend. Los datos de 1986 están ausentes. El número de observaciones reales por fecha: 29.
Fuente (nombre):
Indicadores del desarrollo mundial
Fuente (organización):
United Nations Educational, Scientific, and Cultural Organization (UNESCO) Institute for Statistics.
Categorías:
Education
Se ha actualizado:
23 abr 2017 año
Los indicadores de los cambios de valor en los últimos años
Mínimo:
82.955
1 ene 1987 año
Máximo:
93.16
1 ene 2007 año
A la fecha de observación
Valor
Cambio absoluto
El cambio con respecto al valor anterior
1 ene 1987 año
82.955
+82.955
0.0%
1 ene 1988 año
83.684
+0.73
0.88%
1 ene 1989 año
84.596
+0.912
1.09%
1 ene 1990 año
85.472
+0.876
1.04%
1 ene 1991 año
86.268
+0.795
0.93%
1 ene 1992 año
86.875
+0.607
0.7%
1 ene 1993 año
87.642
+0.767
0.88%
1 ene 1994 año
88.149
+0.508
0.58%
1 ene 1995 año
87.781
-0.368
-0.42%
1 ene 1996 año
87.877
+0.096
0.11%
1 ene 1997 año
87.869
-0.008
-0.01%
1 ene 1998 año
88.653
+0.783
0.89%
1 ene 1999 año
88.519
-0.133
-0.15%
1 ene 2000 año
87.895
-0.624
-0.7%
1 ene 2001 año
88.682
+0.787
0.9%
1 ene 2002 año
88.953
+0.27
0.3%
1 ene 2003 año
89.998
+1.046
1.18%
1 ene 2004 año
90.547
+0.549
0.61%
1 ene 2005 año
91.231
+0.684
0.76%
1 ene 2006 año
91.754
+0.523
0.57%
1 ene 2007 año
93.16
+1.406
1.53%
1 ene 2008 año
93.071
-0.089
-0.1%
1 ene 2009 año
92.631
-0.439
-0.47%
1 ene 2010 año
91.434
-1.198
-1.29%
1 ene 2011 año
92.84
+1.406
1.54%
1 ene 2012 año
92.42
-0.42
-0.45%
1 ene 2013 año
92.235
-0.184
-0.2%
1 ene 2014 año
91.909
-0.326
-0.35%
1 ene 2015 año
92.153
+0.244
0.27%
Ranking de los países por los datos estadísticos actuales


Comentarios: