29
/es/
es
AIzaSyAYiBZKx7MnpbEhh9jyipgxe19OcubqV5w
April 1, 2024
54796
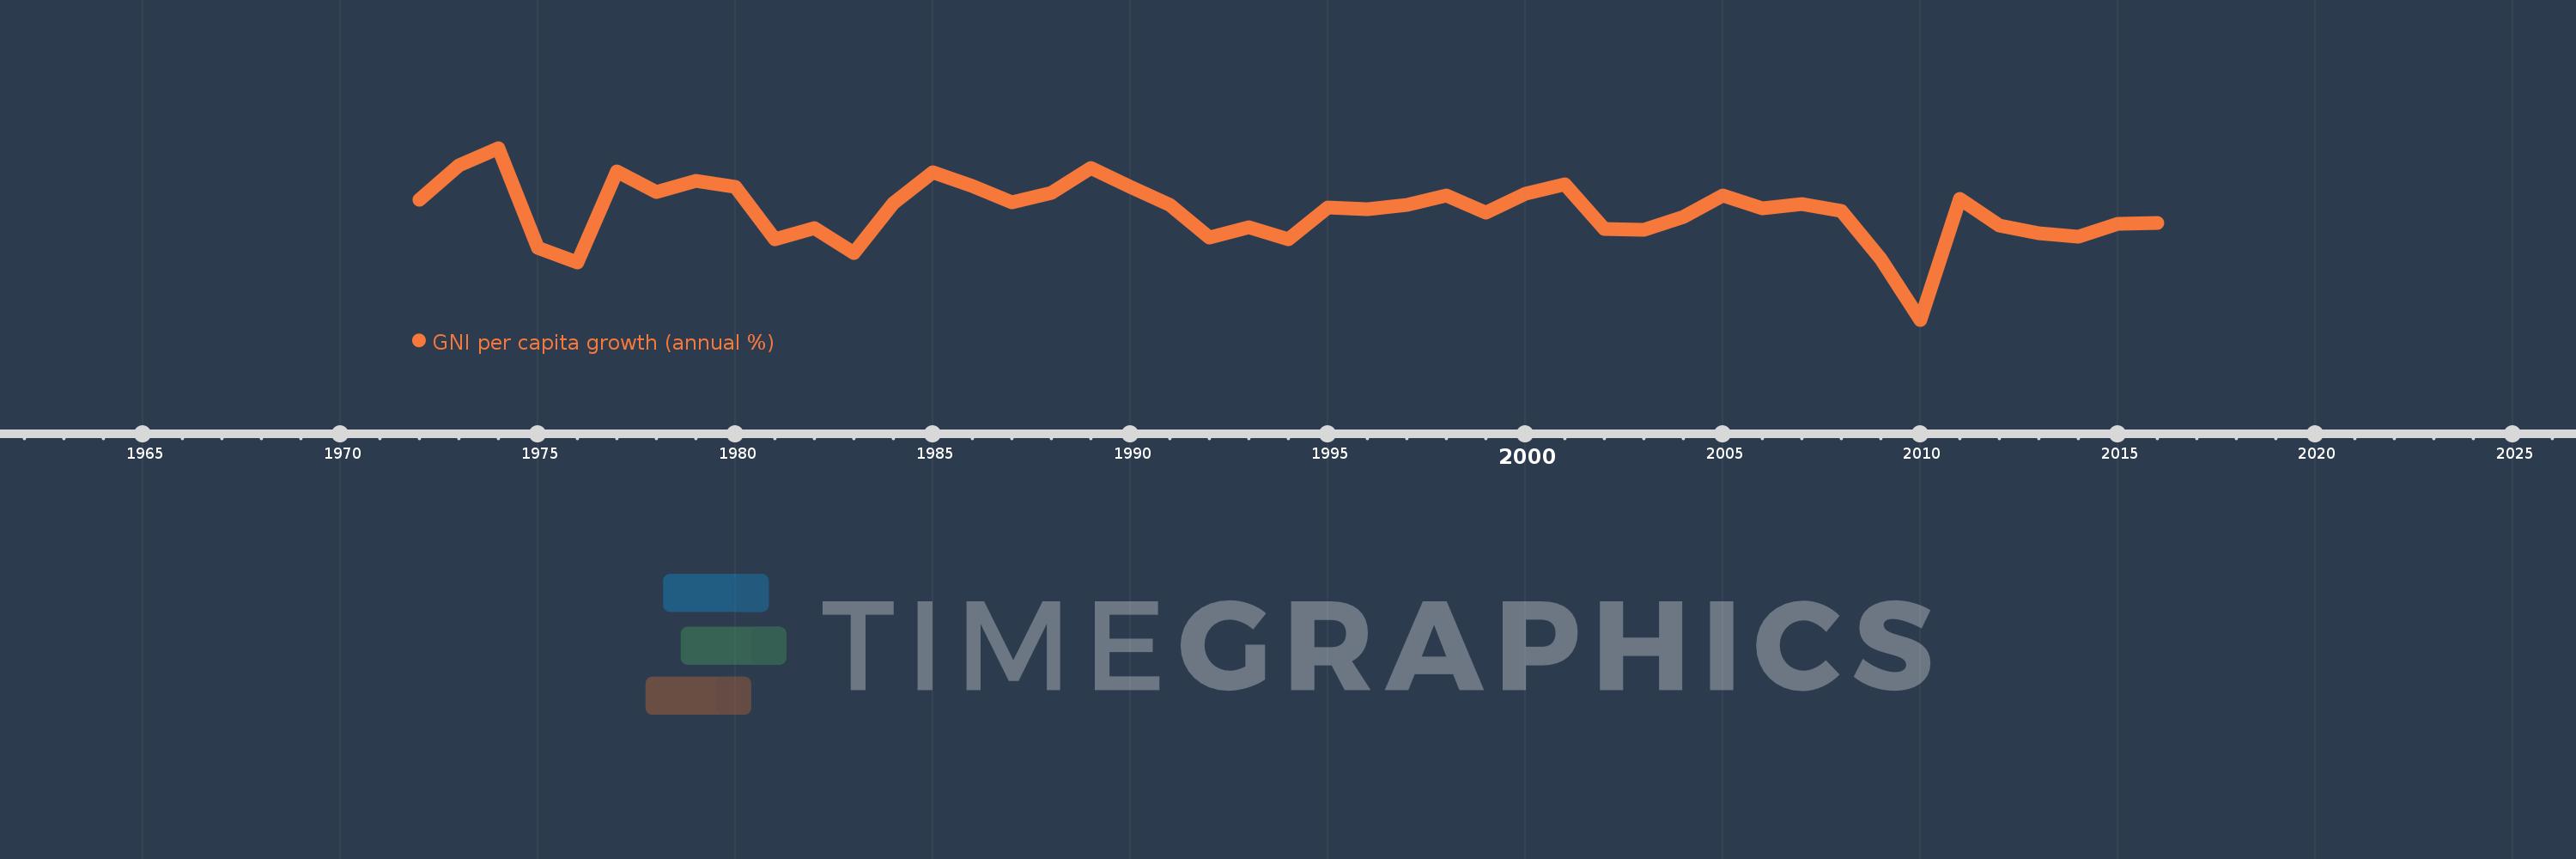
Post-demographic dividend
PST
false
2
1
GNI per capita growth (annual %)
2016,2015,2014,2013,2012,2011,2010,2009,2008,2007,2006,2005,2004,2003,2002,2001,2000,1999,1998,1997,1996,1995,1994,1993,1992,1991,1990,1989,1988,1987,1986,1985,1984,1983,1982,1981,1980,1979,1978,1977,1976,1975,1974,1973,1972
Estas estadísticas en otros países:
AlbaniaAlgeriaAngolaAntigua and BarbudaArab WorldArgentinaArmeniaAustraliaAustriaAzerbaijanBahamas, TheBahrainBangladeshBarbadosBelarusBelgiumBelizeBeninBhutanBoliviaBosnia and HerzegovinaBotswanaBrazilBrunei DarussalamBulgariaBurkina FasoBurundiCabo VerdeCambodiaCameroonCanadaCaribbean small statesCentral Europe and the BalticsChadChileChinaColombiaComorosCongo, Dem. Rep.Congo, Rep.Costa RicaCote d'IvoireCroatiaCubaCyprusCzech RepublicDenmarkDjiboutiDominican RepublicEarly-demographic dividendEast Asia & PacificEast Asia & Pacific (excluding high income)East Asia & Pacific (IDA & IBRD countries)EcuadorEgypt, Arab Rep.El SalvadorEquatorial GuineaEritreaEstoniaEthiopiaEuro areaEurope & Central AsiaEurope & Central Asia (excluding high income)Europe & Central Asia (IDA & IBRD countries)European UnionFijiFinlandFranceGabonGambia, TheGeorgiaGermanyGhanaGreeceGuatemalaGuineaGuinea-BissauHaitiHeavily indebted poor countries (HIPC)High incomeHondurasHong Kong SAR, ChinaHungaryIBRD onlyIcelandIDA & IBRD totalIDA blendIDA onlyIDA totalIndiaIndonesiaIran, Islamic Rep.IrelandIsraelItalyJamaicaJapanJordanKazakhstanKenyaKorea, Rep.KosovoKuwaitKyrgyz RepublicLao PDRLate-demographic dividendLatin America & Caribbean Latin America & Caribbean (excluding high income)Latin America & the Caribbean (IDA & IBRD countries)LatviaLeast developed countries: UN classificationLebanonLiberiaLibyaLithuaniaLow & middle incomeLow incomeLower middle incomeLuxembourgMacao SAR, ChinaMacedonia, FYRMadagascarMalawiMalaysiaMaliMaltaMauritaniaMauritiusMexicoMiddle East & North AfricaMiddle East & North Africa (excluding high income)Middle East & North Africa (IDA & IBRD countries)Middle incomeMoldovaMongoliaMontenegroMoroccoMozambiqueMyanmarNamibiaNepalNetherlandsNew ZealandNicaraguaNigerNigeriaNorth AmericaNorwayOECD membersOmanOther small statesPakistanPanamaPapua New GuineaParaguayPeruPhilippinesPolandPortugalPost-demographic dividendPre-demographic dividendPuerto RicoQatarRomaniaRussian FederationRwandaSamoaSaudi ArabiaSenegalSerbiaSeychellesSierra LeoneSingaporeSlovak RepublicSloveniaSmall statesSomaliaSouth AfricaSouth AsiaSouth Asia (IDA & IBRD)South SudanSpainSri LankaSub-Saharan Africa Sub-Saharan Africa (excluding high income)Sub-Saharan Africa (IDA & IBRD countries)SudanSurinameSwazilandSwedenSwitzerlandSyrian Arab RepublicTajikistanTanzaniaThailandTimor-LesteTogoTrinidad and TobagoTunisiaTurkeyTurkmenistanUgandaUkraineUnited Arab EmiratesUnited KingdomUnited StatesUpper middle incomeUruguayUzbekistanVanuatuVenezuela, RBVietnamWest Bank and GazaWorldZambiaZimbabwe línea de tiempo (timeline):
En esta escala de tiempo se presenta un gráfico de 1972 y 2016 de Post-demographic dividend. Los datos de 1971 están ausentes. El número de observaciones reales por fecha: 45.
Fuente (nombre):
Indicadores del desarrollo mundial
Fuente (organización):
World Bank national accounts data, and OECD National Accounts data files.
Categorías:
Economy & Growth
Se ha actualizado:
23 abr 2017 año
Los indicadores de los cambios de valor en los últimos años
Mínimo:
-3.939
1 ene 2010 año
Máximo:
5.43
1 ene 1974 año
A la fecha de observación
Valor
Cambio absoluto
El cambio con respecto al valor anterior
1 ene 1972 año
2.621
+2.621
0.0%
1 ene 1973 año
4.464
+1.843
70.31%
1 ene 1974 año
5.43
+0.966
21.64%
1 ene 1975 año
-0.01
-5.44
-100.19%
1 ene 1976 año
-0.829
-0.819
7.99 mil%
1 ene 1977 año
4.158
+4.988
-601.46%
1 ene 1978 año
3.028
-1.13
-27.18%
1 ene 1979 año
3.618
+0.59
19.5%
1 ene 1980 año
3.305
-0.314
-8.67%
1 ene 1981 año
0.442
-2.863
-86.63%
1 ene 1982 año
1.06
+0.618
139.87%
1 ene 1983 año
-0.32
-1.38
-130.2%
1 ene 1984 año
2.419
+2.739
-855.84%
1 ene 1985 año
4.086
+1.667
68.9%
1 ene 1986 año
3.338
-0.748
-18.3%
1 ene 1987 año
2.444
-0.894
-26.79%
1 ene 1988 año
2.968
+0.524
21.46%
1 ene 1989 año
4.354
+1.386
46.69%
1 ene 1990 año
3.307
-1.047
-24.05%
1 ene 1991 año
2.323
-0.984
-29.75%
1 ene 1992 año
0.549
-1.774
-76.36%
1 ene 1993 año
1.111
+0.562
102.32%
1 ene 1994 año
0.434
-0.677
-60.9%
1 ene 1995 año
2.177
+1.742
401.12%
1 ene 1996 año
2.078
-0.099
-4.56%
1 ene 1997 año
2.325
+0.247
11.89%
1 ene 1998 año
2.82
+0.495
21.29%
1 ene 1999 año
1.916
-0.904
-32.05%
1 ene 2000 año
2.943
+1.028
53.63%
1 ene 2001 año
3.434
+0.491
16.67%
1 ene 2002 año
1.009
-2.425
-70.62%
1 ene 2003 año
0.966
-0.044
-4.32%
1 ene 2004 año
1.67
+0.704
72.93%
1 ene 2005 año
2.822
+1.152
69.01%
1 ene 2006 año
2.131
-0.691
-24.47%
1 ene 2007 año
2.378
+0.247
11.57%
1 ene 2008 año
1.982
-0.396
-16.64%
1 ene 2009 año
-0.628
-2.61
-131.67%
1 ene 2010 año
-3.939
-3.311
527.3%
1 ene 2011 año
2.671
+6.61
-167.82%
1 ene 2012 año
1.187
-1.484
-55.56%
1 ene 2013 año
0.8
-0.387
-32.64%
1 ene 2014 año
0.602
-0.197
-24.64%
1 ene 2015 año
1.285
+0.682
113.25%
1 ene 2016 año
1.348
+0.063
4.93%
Ranking de los países por los datos estadísticos actuales


Comentarios: