29
/es/
es
AIzaSyAYiBZKx7MnpbEhh9jyipgxe19OcubqV5w
April 1, 2024
53753
Other small states
OSS
false
2
1
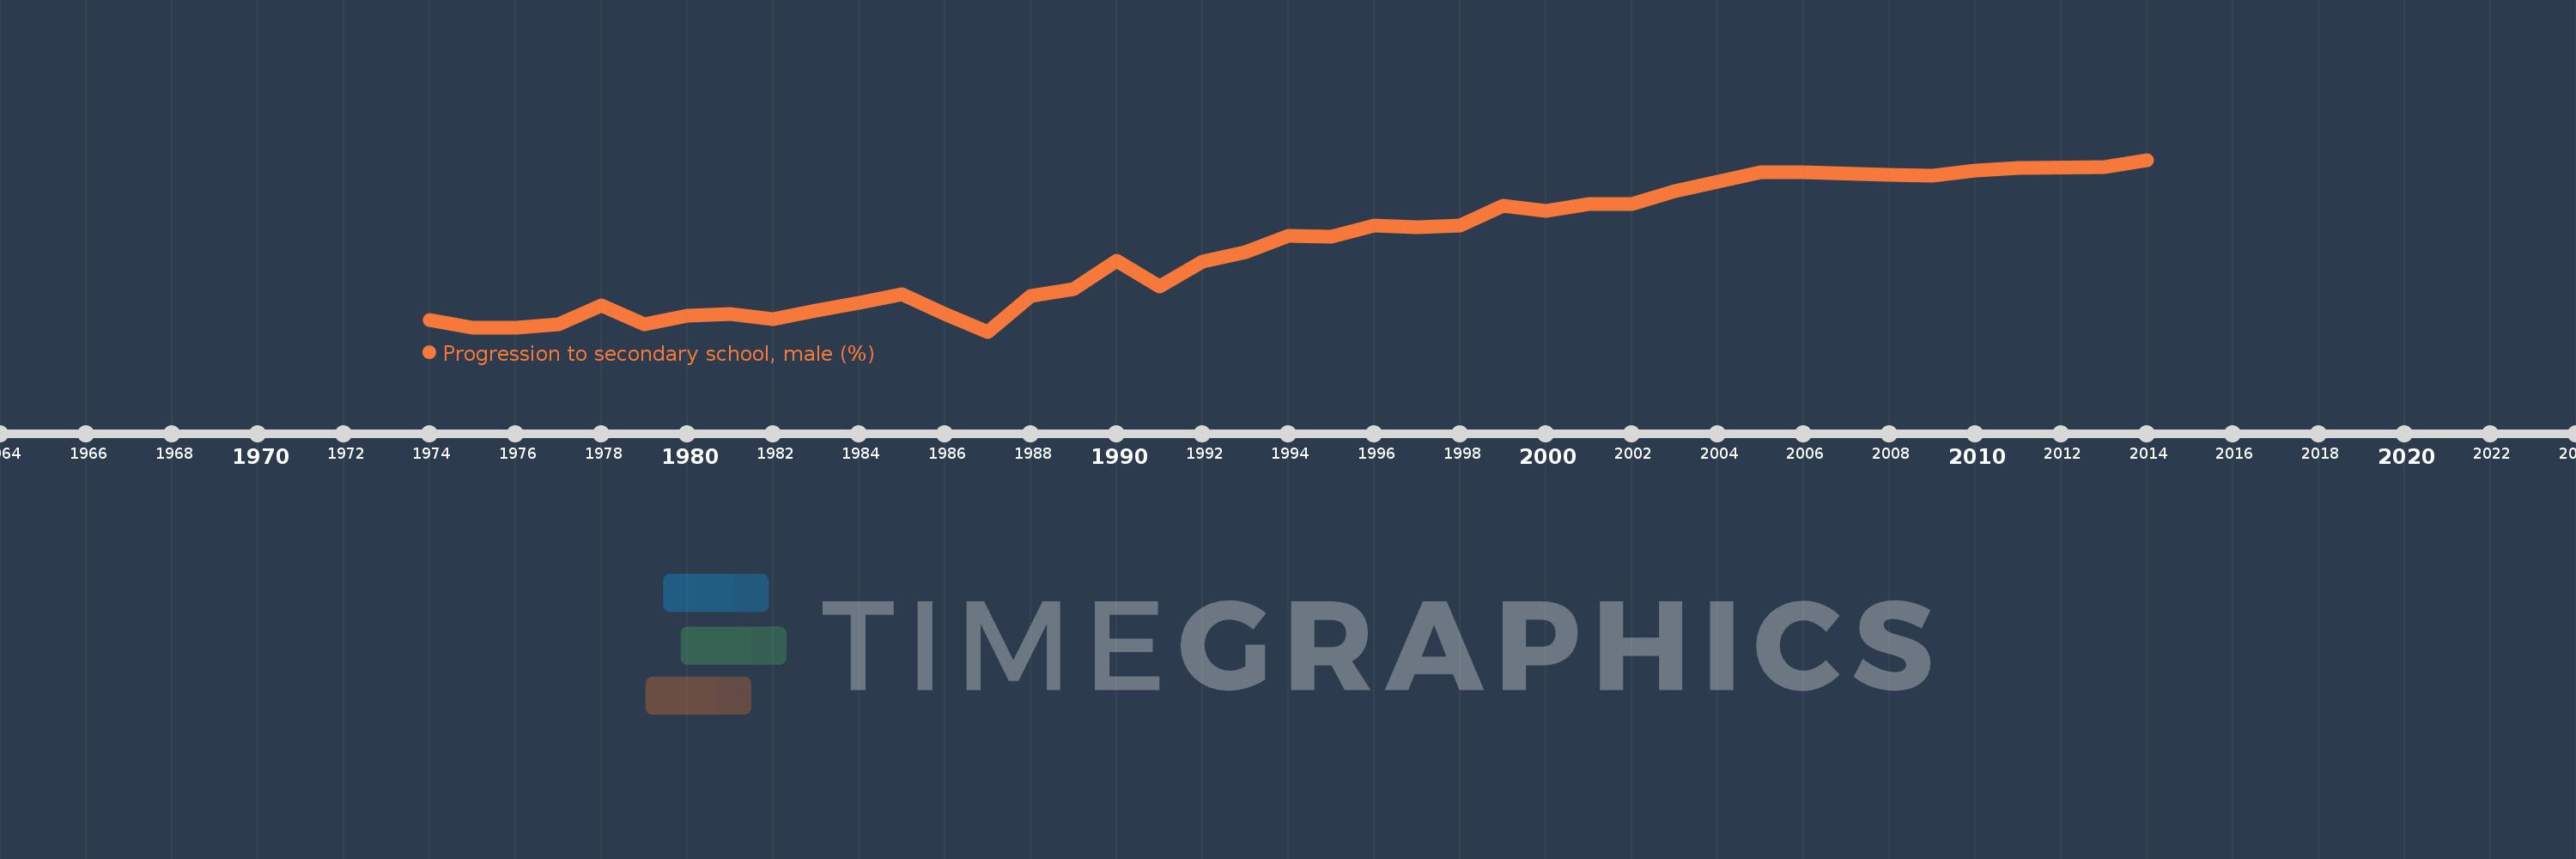
Progression to secondary school, male (%)
2014,2013,2011,2010,2009,2008,2006,2005,2004,2003,2002,2001,2000,1999,1998,1997,1996,1995,1994,1993,1992,1991,1990,1989,1988,1987,1986,1985,1984,1983,1982,1981,1980,1979,1978,1977,1976,1975,1974
Estas estadísticas en otros países:
AfghanistanAlbaniaAlgeriaAngolaAntigua and BarbudaArab WorldArgentinaArmeniaArubaAustriaAzerbaijanBahamas, TheBahrainBarbadosBelarusBelgiumBelizeBeninBermudaBhutanBoliviaBosnia and HerzegovinaBotswanaBrazilBritish Virgin IslandsBrunei DarussalamBulgariaBurkina FasoBurundiCabo VerdeCambodiaCameroonCaribbean small statesCayman IslandsCentral African RepublicCentral Europe and the BalticsChadChileChinaColombiaComorosCongo, Dem. Rep.Congo, Rep.Costa RicaCote d'IvoireCroatiaCubaCyprusCzech RepublicDenmarkDjiboutiDominicaDominican RepublicEarly-demographic dividendEast Asia & PacificEast Asia & Pacific (excluding high income)East Asia & Pacific (IDA & IBRD countries)EcuadorEgypt, Arab Rep.El SalvadorEquatorial GuineaEritreaEstoniaEthiopiaEuro areaEurope & Central AsiaEurope & Central Asia (excluding high income)Europe & Central Asia (IDA & IBRD countries)European UnionFijiFinlandFragile and conflict affected situationsGabonGambia, TheGeorgiaGermanyGhanaGreeceGrenadaGuatemalaGuineaGuinea-BissauGuyanaHaitiHeavily indebted poor countries (HIPC)High incomeHondurasHong Kong SAR, ChinaHungaryIBRD onlyIcelandIDA & IBRD totalIDA blendIDA onlyIDA totalIndiaIndonesiaIran, Islamic Rep.IraqIsraelItalyJamaicaJapanJordanKazakhstanKenyaKiribatiKorea, Rep.KuwaitKyrgyz RepublicLao PDRLate-demographic dividendLatin America & Caribbean Latin America & Caribbean (excluding high income)Latin America & the Caribbean (IDA & IBRD countries)LatviaLeast developed countries: UN classificationLebanonLesothoLiberiaLibyaLiechtensteinLithuaniaLow & middle incomeLow incomeLower middle incomeLuxembourgMacao SAR, ChinaMacedonia, FYRMadagascarMalawiMalaysiaMaldivesMaliMaltaMarshall IslandsMauritaniaMauritiusMexicoMiddle East & North AfricaMiddle East & North Africa (excluding high income)Middle East & North Africa (IDA & IBRD countries)Middle incomeMoldovaMonacoMongoliaMoroccoMozambiqueMyanmarNamibiaNepalNetherlandsNicaraguaNigerNorwayOECD membersOmanOther small statesPacific island small statesPakistanPalauPanamaParaguayPeruPhilippinesPolandPortugalPost-demographic dividendPre-demographic dividendQatarRomaniaRussian FederationRwandaSamoaSan MarinoSao Tome and PrincipeSaudi ArabiaSenegalSerbiaSeychellesSierra LeoneSingaporeSlovak RepublicSloveniaSmall statesSolomon IslandsSouth AfricaSouth AsiaSouth Asia (IDA & IBRD)SpainSri LankaSt. Kitts and NevisSt. LuciaSt. Vincent and the GrenadinesSub-Saharan Africa Sub-Saharan Africa (excluding high income)Sub-Saharan Africa (IDA & IBRD countries)SudanSurinameSwazilandSwedenSwitzerlandSyrian Arab RepublicTajikistanTanzaniaThailandTimor-LesteTogoTongaTrinidad and TobagoTunisiaTurkeyTurks and Caicos IslandsTuvaluUgandaUkraineUnited Arab EmiratesUpper middle incomeUruguayUzbekistanVanuatuVenezuela, RBVietnamWest Bank and GazaWorldYemen, Rep.ZambiaZimbabwe línea de tiempo (timeline):
En esta escala de tiempo se presenta un gráfico de 1974 y 2014 de Other small states. Los datos de 1973 están ausentes. El número de observaciones reales por fecha: 39.
Fuente (nombre):
Indicadores del desarrollo mundial
Fuente (organización):
United Nations Educational, Scientific, and Cultural Organization (UNESCO) Institute for Statistics.
Categorías:
Education, Gender
Se ha actualizado:
23 abr 2017 año
Los indicadores de los cambios de valor en los últimos años
Mínimo:
65.23
1 ene 1987 año
Máximo:
90.918
1 ene 2014 año
A la fecha de observación
Valor
Cambio absoluto
El cambio con respecto al valor anterior
1 ene 1974 año
66.901
+66.901
0.0%
1 ene 1975 año
65.823
-1.078
-1.61%
1 ene 1976 año
65.851
+0.027
0.04%
1 ene 1977 año
66.312
+0.461
0.7%
1 ene 1978 año
69.193
+2.881
4.35%
1 ene 1979 año
66.265
-2.929
-4.23%
1 ene 1980 año
67.667
+1.402
2.12%
1 ene 1981 año
67.84
+0.173
0.26%
1 ene 1982 año
67.057
-0.783
-1.15%
1 ene 1983 año
68.38
+1.323
1.97%
1 ene 1984 año
69.549
+1.169
1.71%
1 ene 1985 año
70.831
+1.282
1.84%
1 ene 1986 año
67.836
-2.995
-4.23%
1 ene 1987 año
65.23
-2.606
-3.84%
1 ene 1988 año
70.572
+5.342
8.19%
1 ene 1989 año
71.562
+0.991
1.4%
1 ene 1990 año
75.842
+4.28
5.98%
1 ene 1991 año
71.909
-3.933
-5.19%
1 ene 1992 año
75.757
+3.848
5.35%
1 ene 1993 año
77.105
+1.348
1.78%
1 ene 1994 año
79.513
+2.408
3.12%
1 ene 1995 año
79.477
-0.035
-0.04%
1 ene 1996 año
81.106
+1.629
2.05%
1 ene 1997 año
80.822
-0.284
-0.35%
1 ene 1998 año
81.144
+0.323
0.4%
1 ene 1999 año
83.989
+2.844
3.51%
1 ene 2000 año
83.333
-0.655
-0.78%
1 ene 2001 año
84.339
+1.006
1.21%
1 ene 2002 año
84.255
-0.084
-0.1%
1 ene 2003 año
86.252
+1.997
2.37%
1 ene 2004 año
87.587
+1.335
1.55%
1 ene 2005 año
89.063
+1.476
1.69%
1 ene 2006 año
89.104
+0.041
0.05%
1 ene 2008 año
88.641
-0.464
-0.52%
1 ene 2009 año
88.481
-0.16
-0.18%
1 ene 2010 año
89.287
+0.807
0.91%
1 ene 2011 año
89.757
+0.469
0.53%
1 ene 2013 año
89.824
+0.067
0.07%
1 ene 2014 año
90.918
+1.095
1.22%
Ranking de los países por los datos estadísticos actuales


Comentarios: