29
/es/
es
AIzaSyAYiBZKx7MnpbEhh9jyipgxe19OcubqV5w
April 1, 2024
52982
OECD members
OED
false
2
1
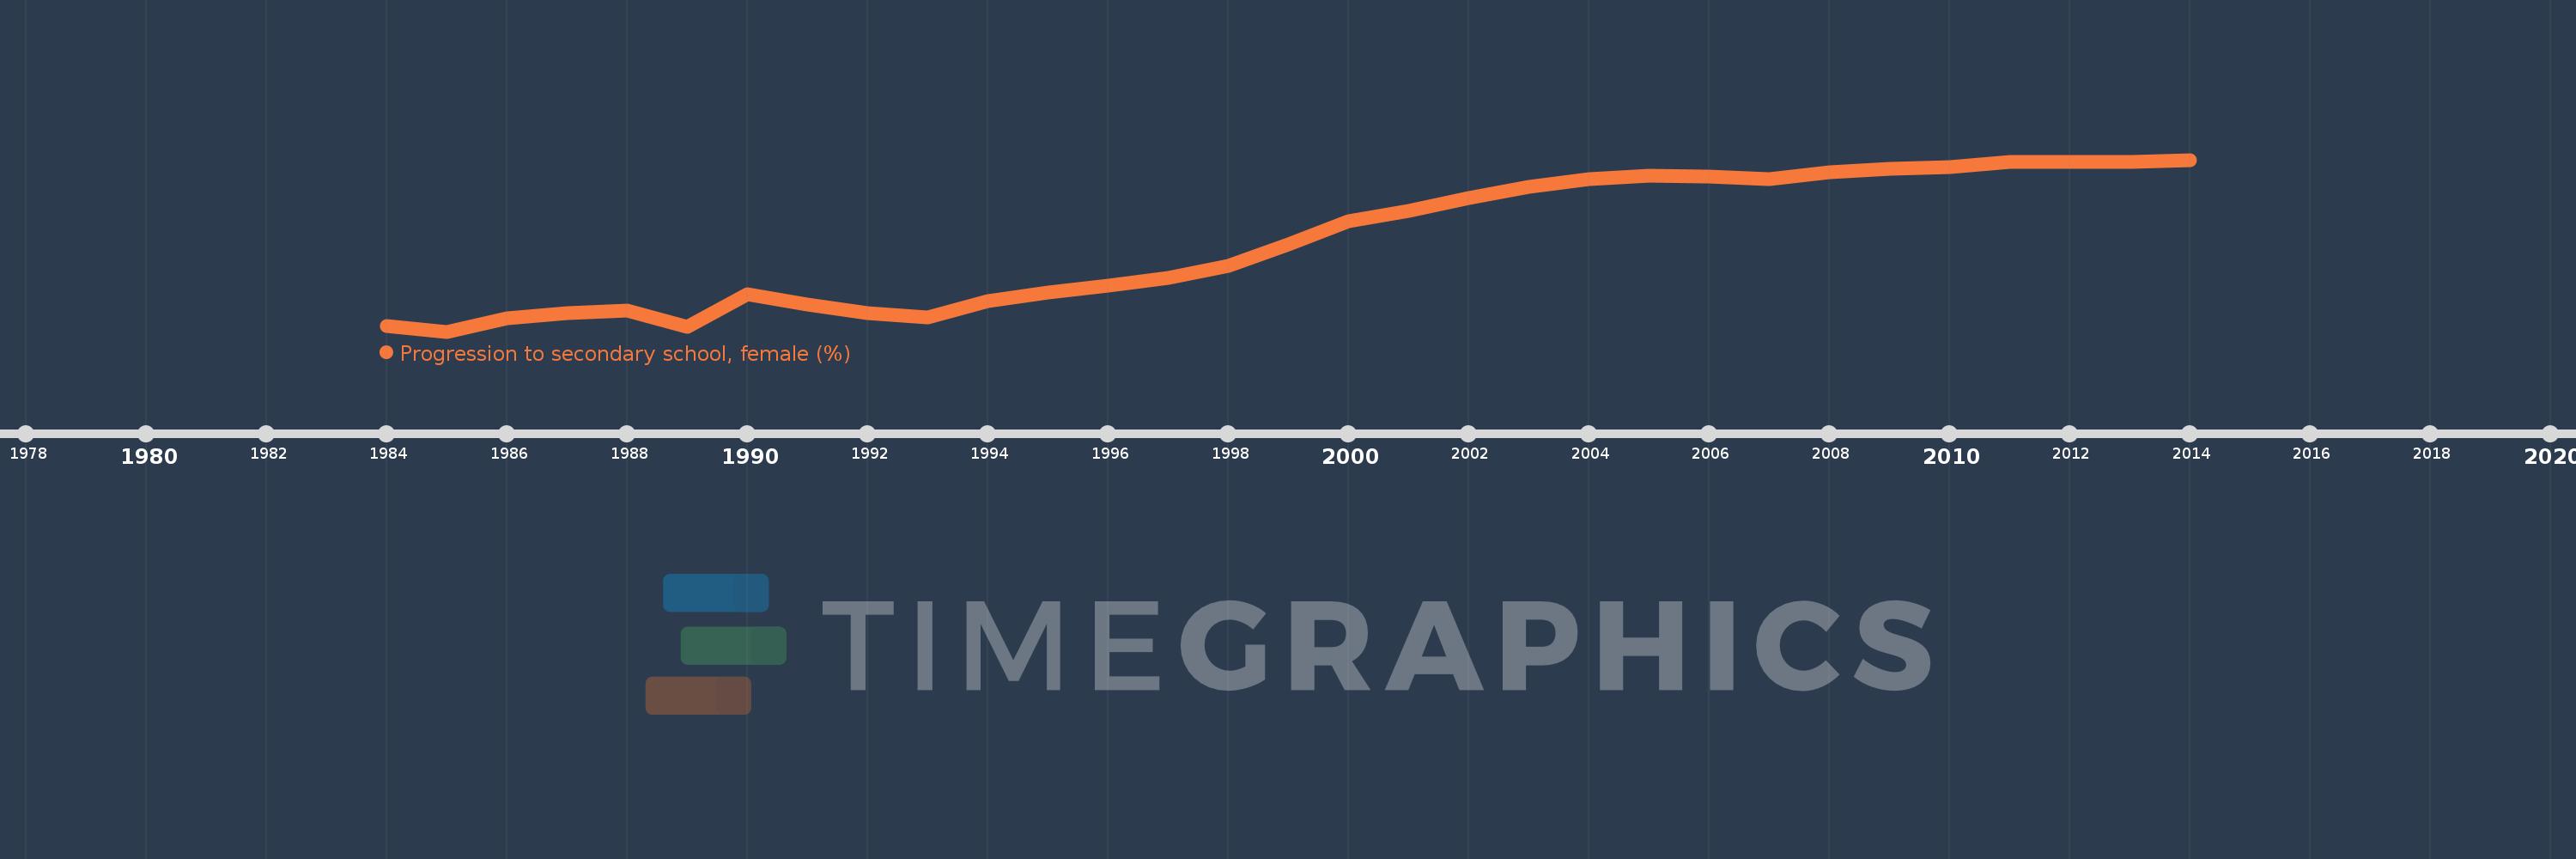
Progression to secondary school, female (%)
2014,2013,2012,2011,2010,2009,2008,2007,2006,2005,2004,2003,2002,2001,2000,1999,1998,1997,1996,1995,1994,1993,1992,1991,1990,1989,1988,1987,1986,1985,1984
Estas estadísticas en otros países:
AfghanistanAlbaniaAlgeriaAngolaAntigua and BarbudaArab WorldArgentinaArmeniaArubaAustriaAzerbaijanBahamas, TheBahrainBarbadosBelarusBelgiumBelizeBeninBermudaBhutanBoliviaBosnia and HerzegovinaBotswanaBrazilBritish Virgin IslandsBrunei DarussalamBulgariaBurkina FasoBurundiCabo VerdeCambodiaCameroonCaribbean small statesCayman IslandsCentral African RepublicCentral Europe and the BalticsChadChileChinaColombiaComorosCongo, Dem. Rep.Congo, Rep.Costa RicaCote d'IvoireCroatiaCubaCyprusCzech RepublicDenmarkDjiboutiDominicaDominican RepublicEarly-demographic dividendEast Asia & PacificEast Asia & Pacific (excluding high income)East Asia & Pacific (IDA & IBRD countries)EcuadorEgypt, Arab Rep.El SalvadorEquatorial GuineaEritreaEstoniaEthiopiaEuro areaEurope & Central AsiaEurope & Central Asia (excluding high income)Europe & Central Asia (IDA & IBRD countries)European UnionFijiFinlandFragile and conflict affected situationsGabonGambia, TheGeorgiaGermanyGhanaGreeceGrenadaGuatemalaGuineaGuinea-BissauGuyanaHaitiHeavily indebted poor countries (HIPC)High incomeHondurasHong Kong SAR, ChinaHungaryIBRD onlyIcelandIDA & IBRD totalIDA blendIDA onlyIDA totalIndiaIndonesiaIran, Islamic Rep.IraqIsraelItalyJamaicaJapanJordanKazakhstanKenyaKiribatiKorea, Rep.KuwaitKyrgyz RepublicLao PDRLate-demographic dividendLatin America & Caribbean Latin America & Caribbean (excluding high income)Latin America & the Caribbean (IDA & IBRD countries)LatviaLeast developed countries: UN classificationLebanonLesothoLiberiaLibyaLiechtensteinLithuaniaLow & middle incomeLow incomeLower middle incomeLuxembourgMacao SAR, ChinaMacedonia, FYRMadagascarMalawiMalaysiaMaldivesMaliMaltaMarshall IslandsMauritaniaMauritiusMexicoMiddle East & North AfricaMiddle East & North Africa (excluding high income)Middle East & North Africa (IDA & IBRD countries)Middle incomeMoldovaMonacoMongoliaMoroccoMozambiqueMyanmarNamibiaNepalNetherlandsNicaraguaNigerNorwayOECD membersOmanOther small statesPacific island small statesPakistanPalauPanamaParaguayPeruPhilippinesPolandPortugalPost-demographic dividendPre-demographic dividendQatarRomaniaRussian FederationRwandaSamoaSan MarinoSao Tome and PrincipeSaudi ArabiaSenegalSerbiaSeychellesSierra LeoneSingaporeSlovak RepublicSloveniaSmall statesSolomon IslandsSouth AfricaSouth AsiaSouth Asia (IDA & IBRD)SpainSri LankaSt. Kitts and NevisSt. LuciaSt. Vincent and the GrenadinesSub-Saharan Africa Sub-Saharan Africa (excluding high income)Sub-Saharan Africa (IDA & IBRD countries)SudanSurinameSwazilandSwedenSwitzerlandSyrian Arab RepublicTajikistanTanzaniaThailandTimor-LesteTogoTongaTrinidad and TobagoTunisiaTurkeyTurks and Caicos IslandsTuvaluUgandaUkraineUnited Arab EmiratesUpper middle incomeUruguayUzbekistanVanuatuVenezuela, RBVietnamWest Bank and GazaWorldYemen, Rep.ZambiaZimbabwe línea de tiempo (timeline):
En esta escala de tiempo se presenta un gráfico de 1984 y 2014 de OECD members. Los datos de 1983 están ausentes. El número de observaciones reales por fecha: 31.
Fuente (nombre):
Indicadores del desarrollo mundial
Fuente (organización):
United Nations Educational, Scientific, and Cultural Organization (UNESCO) Institute for Statistics.
Categorías:
Education, Gender
Se ha actualizado:
23 abr 2017 año
Los indicadores de los cambios de valor en los últimos años
Mínimo:
89.556
1 ene 1985 año
Máximo:
97.122
1 ene 2014 año
A la fecha de observación
Valor
Cambio absoluto
El cambio con respecto al valor anterior
1 ene 1984 año
89.794
+89.794
0.0%
1 ene 1985 año
89.556
-0.237
-0.26%
1 ene 1986 año
90.152
+0.596
0.67%
1 ene 1987 año
90.359
+0.207
0.23%
1 ene 1988 año
90.488
+0.129
0.14%
1 ene 1989 año
89.753
-0.734
-0.81%
1 ene 1990 año
91.209
+1.456
1.62%
1 ene 1991 año
90.741
-0.468
-0.51%
1 ene 1992 año
90.369
-0.372
-0.41%
1 ene 1993 año
90.184
-0.186
-0.21%
1 ene 1994 año
90.909
+0.726
0.8%
1 ene 1995 año
91.286
+0.377
0.41%
1 ene 1996 año
91.588
+0.302
0.33%
1 ene 1997 año
91.923
+0.335
0.37%
1 ene 1998 año
92.433
+0.509
0.55%
1 ene 1999 año
93.405
+0.973
1.05%
1 ene 2000 año
94.424
+1.019
1.09%
1 ene 2001 año
94.869
+0.445
0.47%
1 ene 2002 año
95.441
+0.573
0.6%
1 ene 2003 año
95.913
+0.472
0.49%
1 ene 2004 año
96.281
+0.368
0.38%
1 ene 2005 año
96.422
+0.141
0.15%
1 ene 2006 año
96.391
-0.031
-0.03%
1 ene 2007 año
96.271
-0.121
-0.13%
1 ene 2008 año
96.565
+0.294
0.31%
1 ene 2009 año
96.726
+0.161
0.17%
1 ene 2010 año
96.804
+0.078
0.08%
1 ene 2011 año
97.012
+0.207
0.21%
1 ene 2012 año
97.026
+0.014
0.01%
1 ene 2013 año
97.044
+0.018
0.02%
1 ene 2014 año
97.122
+0.078
0.08%
Ranking de los países por los datos estadísticos actuales


Comentarios: