29
/es/
es
AIzaSyAYiBZKx7MnpbEhh9jyipgxe19OcubqV5w
April 1, 2024
51456
Middle income
MIC
false
2
1
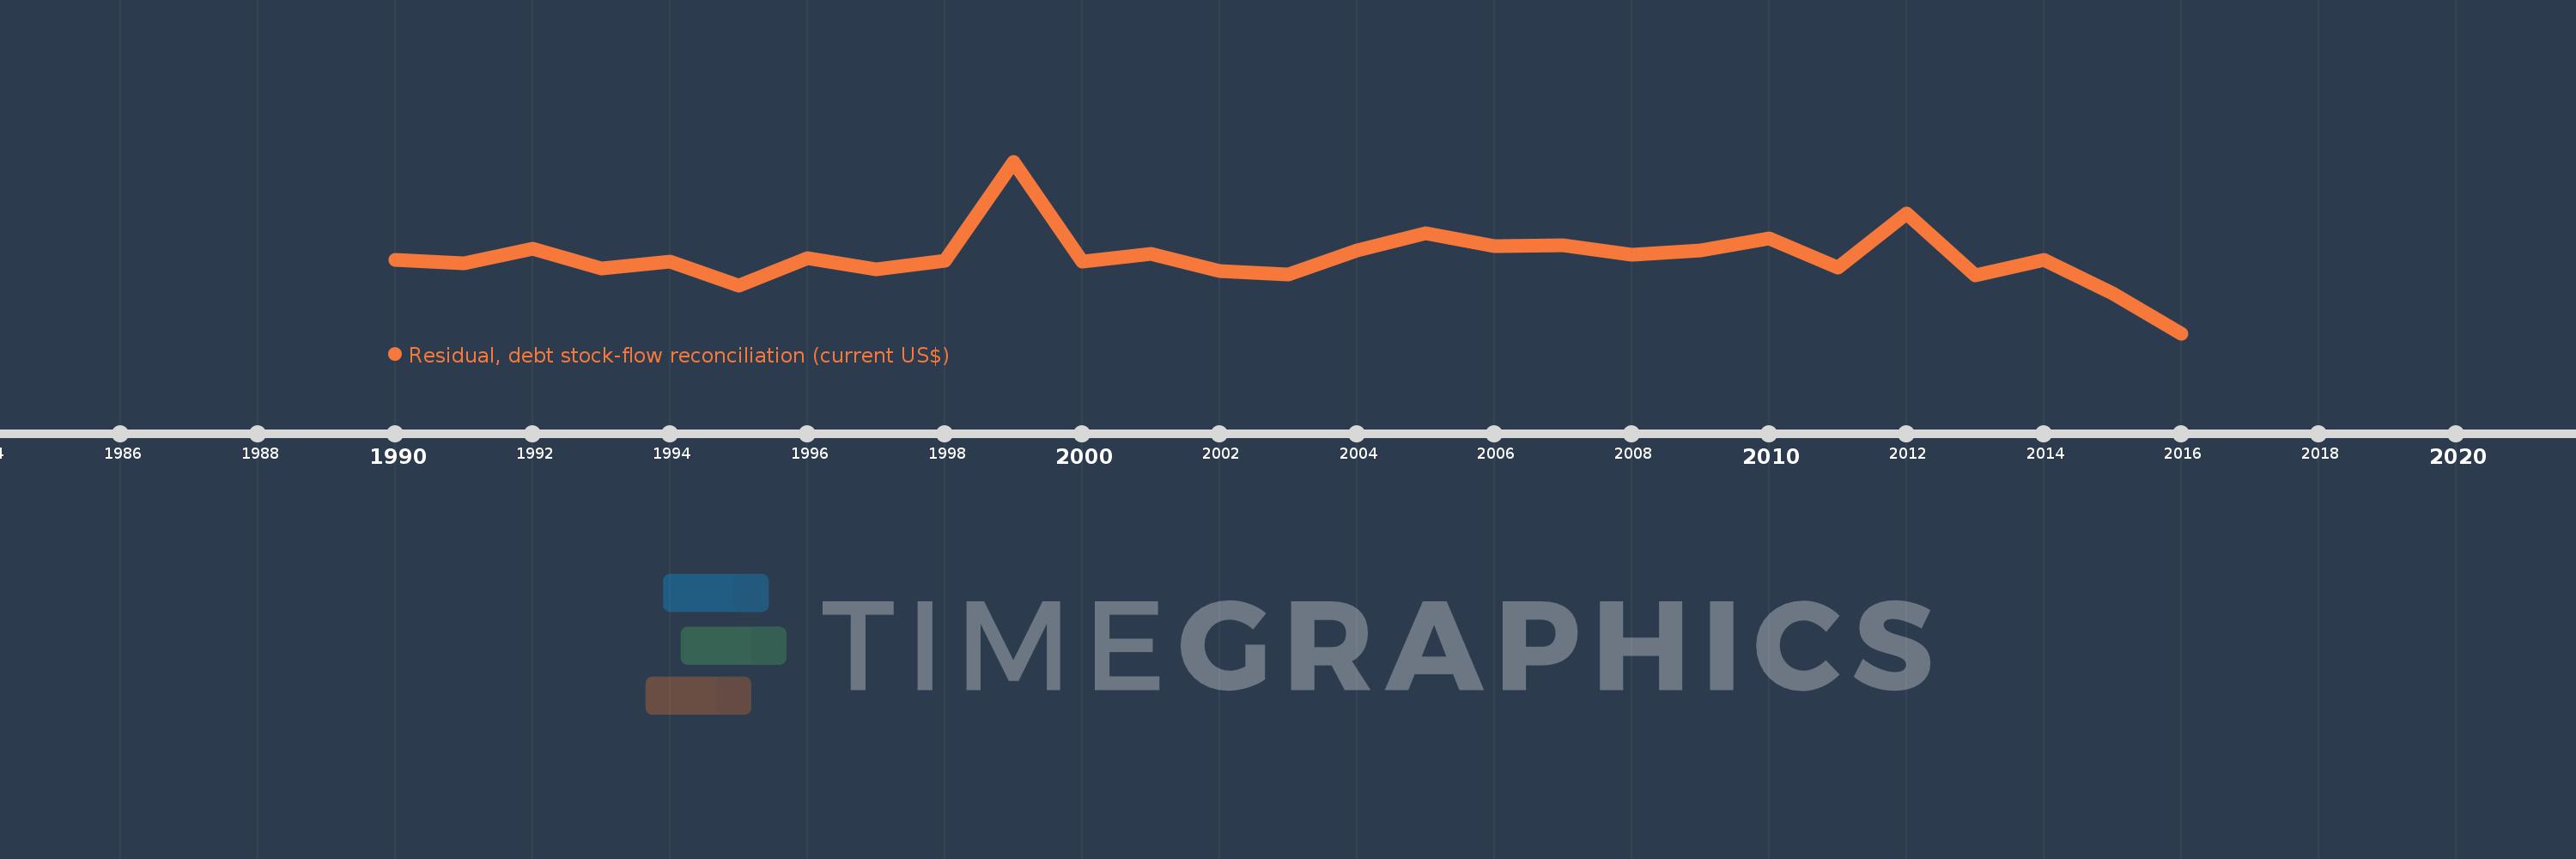
Residual, debt stock-flow reconciliation (current US$)
2016,2015,2014,2013,2012,2011,2010,2009,2008,2007,2006,2005,2004,2003,2002,2001,2000,1999,1998,1997,1996,1995,1994,1993,1992,1991,1990
Estas estadísticas en otros países:
línea de tiempo (timeline):
En esta escala de tiempo se presenta un gráfico de 1990 y 2016 de Middle income. Los datos de 1989 están ausentes. El número de observaciones reales por fecha: 27.
Fuente (nombre):
Indicadores del desarrollo mundial
Fuente (organización):
World Bank, International Debt Statistics.
Categorías:
External Debt
Se ha actualizado:
23 abr 2017 año
Los indicadores de los cambios de valor en los últimos años
Mínimo:
-112.318 bn
1 ene 2016 año
Máximo:
234.006 bn
1 ene 1999 año
A la fecha de observación
Valor
Cambio absoluto
El cambio con respecto al valor anterior
1 ene 1990 año
35.153 bn
+35.153 bn
0.0%
1 ene 1991 año
29.5 bn
-5.653 bn
-16.08%
1 ene 1992 año
57.572 bn
+28.073 bn
95.16%
1 ene 1993 año
19.14 bn
-38.432 bn
-66.75%
1 ene 1994 año
31.643 bn
+12.503 bn
65.32%
1 ene 1995 año
-15.461 bn
-47.105 bn
-148.86%
1 ene 1996 año
39.192 bn
+54.653 bn
-353.48%
1 ene 1997 año
17.286 bn
-21.906 bn
-55.89%
1 ene 1998 año
34.077 bn
+16.791 bn
97.14%
1 ene 1999 año
234.006 bn
+199.929 bn
586.7%
1 ene 2000 año
31.778 bn
-202.227 bn
-86.42%
1 ene 2001 año
48.25 bn
+16.472 bn
51.83%
1 ene 2002 año
13.997 bn
-34.253 bn
-70.99%
1 ene 2003 año
7.094 bn
-6.903 bn
-49.32%
1 ene 2004 año
55.307 bn
+48.214 bn
679.67%
1 ene 2005 año
89.751 bn
+34.443 bn
62.28%
1 ene 2006 año
64.271 bn
-25.48 bn
-28.39%
1 ene 2007 año
64.708 bn
+436.997 millones
0.68%
1 ene 2008 año
45.837 bn
-18.871 bn
-29.16%
1 ene 2009 año
55.602 bn
+9.765 bn
21.3%
1 ene 2010 año
78.448 bn
+22.846 bn
41.09%
1 ene 2011 año
20.571 bn
-57.877 bn
-73.78%
1 ene 2012 año
129.02 bn
+108.449 bn
527.2%
1 ene 2013 año
4.356 bn
-124.664 bn
-96.62%
1 ene 2014 año
35.932 bn
+31.576 bn
724.94%
1 ene 2015 año
-32.299 bn
-68.231 bn
-189.89%
1 ene 2016 año
-112.318 bn
-80.018 bn
247.74%
Ranking de los países por los datos estadísticos actuales


Comentarios: