29
/es/
es
AIzaSyAYiBZKx7MnpbEhh9jyipgxe19OcubqV5w
April 1, 2024
51361
Middle income
MIC
false
2
1
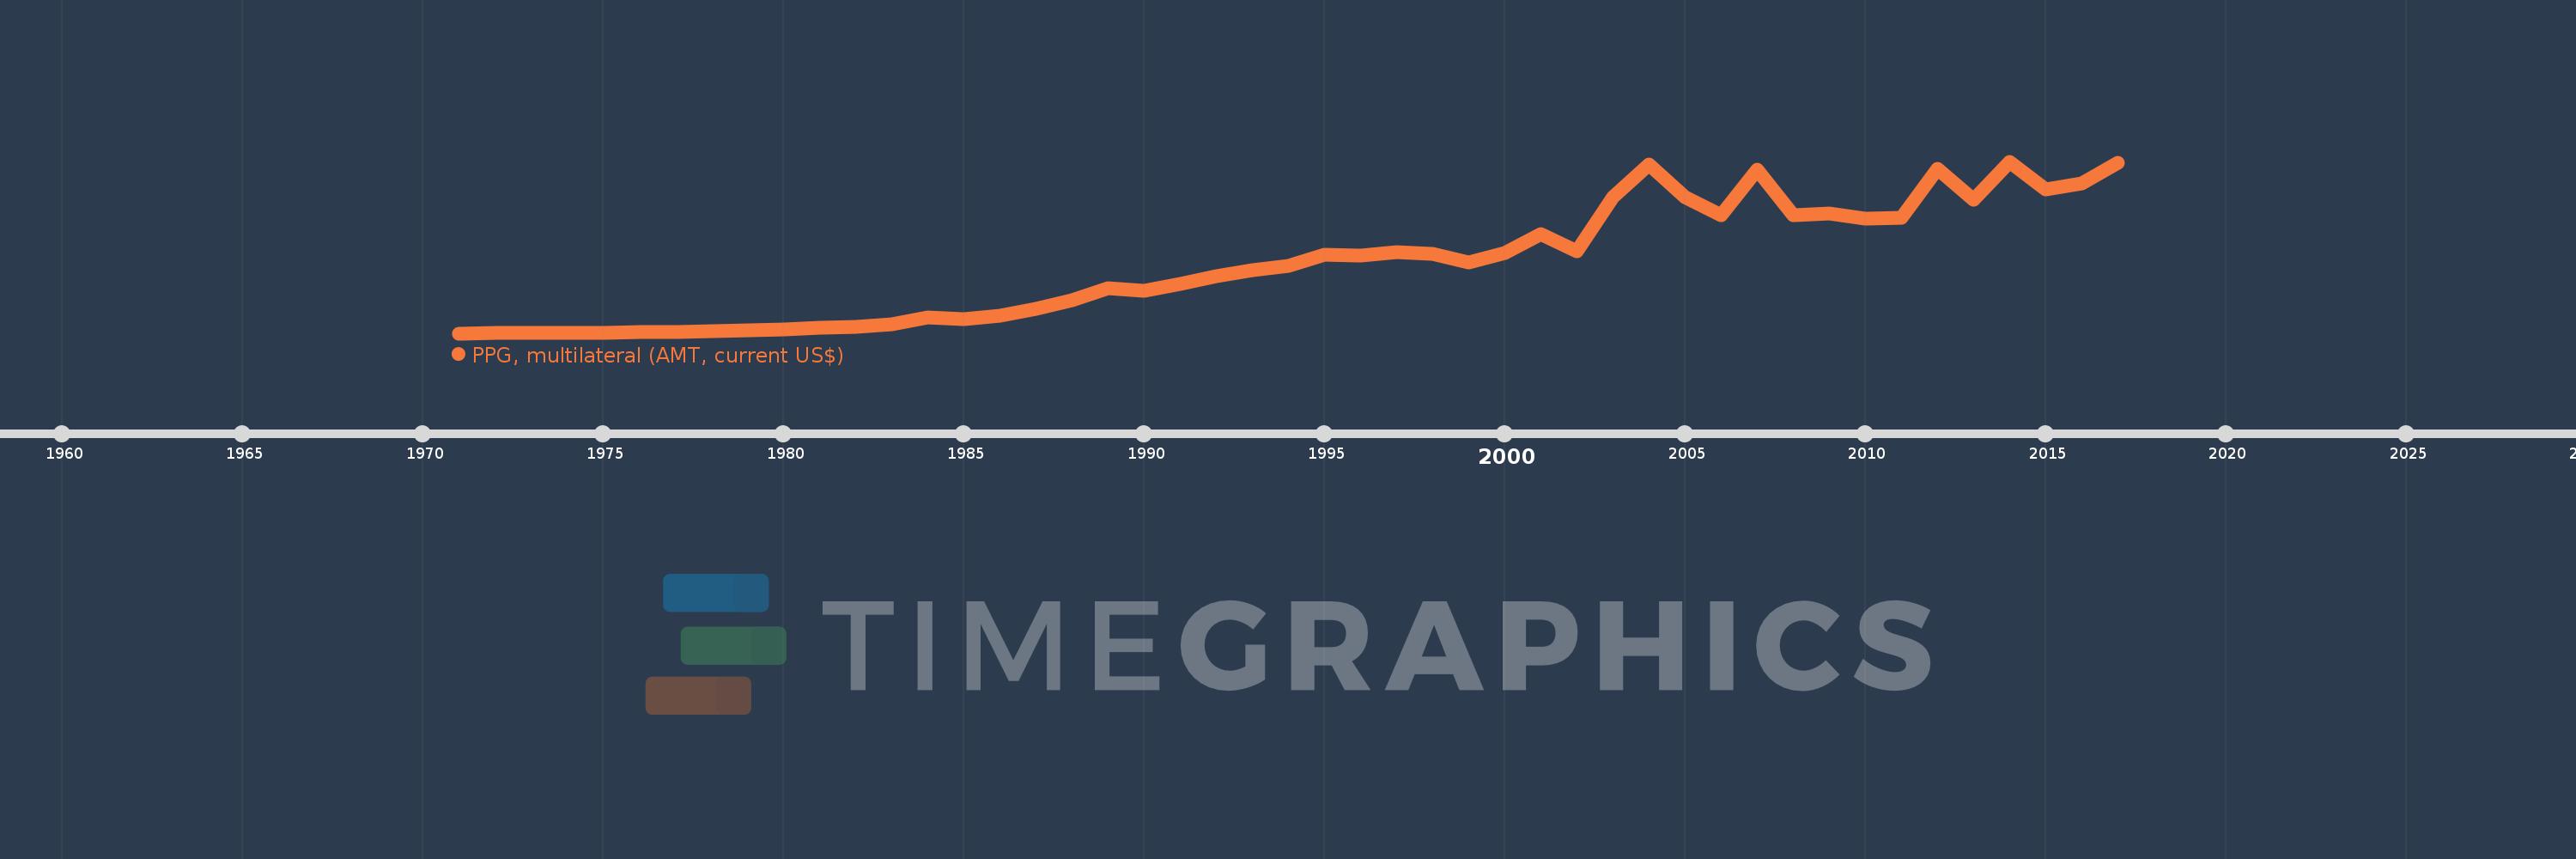
PPG, multilateral (AMT, current US$)
2017,2016,2015,2014,2013,2012,2011,2010,2009,2008,2007,2006,2005,2004,2003,2002,2001,2000,1999,1998,1997,1996,1995,1994,1993,1992,1991,1990,1989,1988,1987,1986,1985,1984,1983,1982,1981,1980,1979,1978,1977,1976,1975,1974,1973,1972,1971
Estas estadísticas en otros países:
línea de tiempo (timeline):
En esta escala de tiempo se presenta un gráfico de 1971 y 2017 de Middle income. Los datos de 1970 están ausentes. El número de observaciones reales por fecha: 47.
Fuente (nombre):
Indicadores del desarrollo mundial
Fuente (organización):
World Bank, International Debt Statistics.
Categorías:
External Debt
Se ha actualizado:
23 abr 2017 año
Los indicadores de los cambios de valor en los últimos años
Mínimo:
401.759 millones
1 ene 1971 año
Máximo:
36.735 bn
1 ene 2014 año
A la fecha de observación
Valor
Cambio absoluto
El cambio con respecto al valor anterior
1 ene 1971 año
401.759 millones
+401.759 millones
0.0%
1 ene 1972 año
421.077 millones
+19.318 millones
4.81%
1 ene 1973 año
477.688 millones
+56.611 millones
13.44%
1 ene 1974 año
499.254 millones
+21.566 millones
4.51%
1 ene 1975 año
537.729 millones
+38.475 millones
7.71%
1 ene 1976 año
587.952 millones
+50.223 millones
9.34%
1 ene 1977 año
695.813 millones
+107.861 millones
18.35%
1 ene 1978 año
873.832 millones
+178.019 millones
25.58%
1 ene 1979 año
986.27 millones
+112.438 millones
12.87%
1 ene 1980 año
1.182 bn
+195.379 millones
19.81%
1 ene 1981 año
1.63 bn
+448.734 millones
37.98%
1 ene 1982 año
1.836 bn
+205.302 millones
12.59%
1 ene 1983 año
2.283 bn
+446.988 millones
24.35%
1 ene 1984 año
3.677 bn
+1.394 bn
61.08%
1 ene 1985 año
3.357 bn
-319.724 millones
-8.7%
1 ene 1986 año
4.036 bn
+678.512 millones
20.21%
1 ene 1987 año
5.575 bn
+1.539 bn
38.14%
1 ene 1988 año
7.307 bn
+1.732 bn
31.08%
1 ene 1989 año
9.921 bn
+2.614 bn
35.78%
1 ene 1990 año
9.347 bn
-574.393 millones
-5.79%
1 ene 1991 año
10.865 bn
+1.518 bn
16.24%
1 ene 1992 año
12.54 bn
+1.675 bn
15.42%
1 ene 1993 año
13.773 bn
+1.232 bn
9.83%
1 ene 1994 año
14.659 bn
+886.583 millones
6.44%
1 ene 1995 año
16.951 bn
+2.292 bn
15.63%
1 ene 1996 año
16.882 bn
-68.792 millones
-0.41%
1 ene 1997 año
17.59 bn
+708.018 millones
4.19%
1 ene 1998 año
17.176 bn
-413.526 millones
-2.35%
1 ene 1999 año
15.403 bn
-1.773 bn
-10.32%
1 ene 2000 año
17.419 bn
+2.016 bn
13.09%
1 ene 2001 año
21.47 bn
+4.051 bn
23.26%
1 ene 2002 año
17.685 bn
-3.785 bn
-17.63%
1 ene 2003 año
29.138 bn
+11.453 bn
64.76%
1 ene 2004 año
36.128 bn
+6.99 bn
23.99%
1 ene 2005 año
29.129 bn
-7.0 bn
-19.37%
1 ene 2006 año
25.382 bn
-3.747 bn
-12.86%
1 ene 2007 año
35.086 bn
+9.705 bn
38.23%
1 ene 2008 año
25.347 bn
-9.739 bn
-27.76%
1 ene 2009 año
25.797 bn
+450.287 millones
1.78%
1 ene 2010 año
24.62 bn
-1.177 bn
-4.56%
1 ene 2011 año
24.775 bn
+155.219 millones
0.63%
1 ene 2012 año
35.127 bn
+10.351 bn
41.78%
1 ene 2013 año
28.599 bn
-6.528 bn
-18.58%
1 ene 2014 año
36.735 bn
+8.136 bn
28.45%
1 ene 2015 año
30.901 bn
-5.835 bn
-15.88%
1 ene 2016 año
32.184 bn
+1.283 bn
4.15%
1 ene 2017 año
36.515 bn
+4.331 bn
13.46%
Ranking de los países por los datos estadísticos actuales


Comentarios: