29
/es/
es
AIzaSyAYiBZKx7MnpbEhh9jyipgxe19OcubqV5w
April 1, 2024
51335
Middle income
MIC
false
2
1
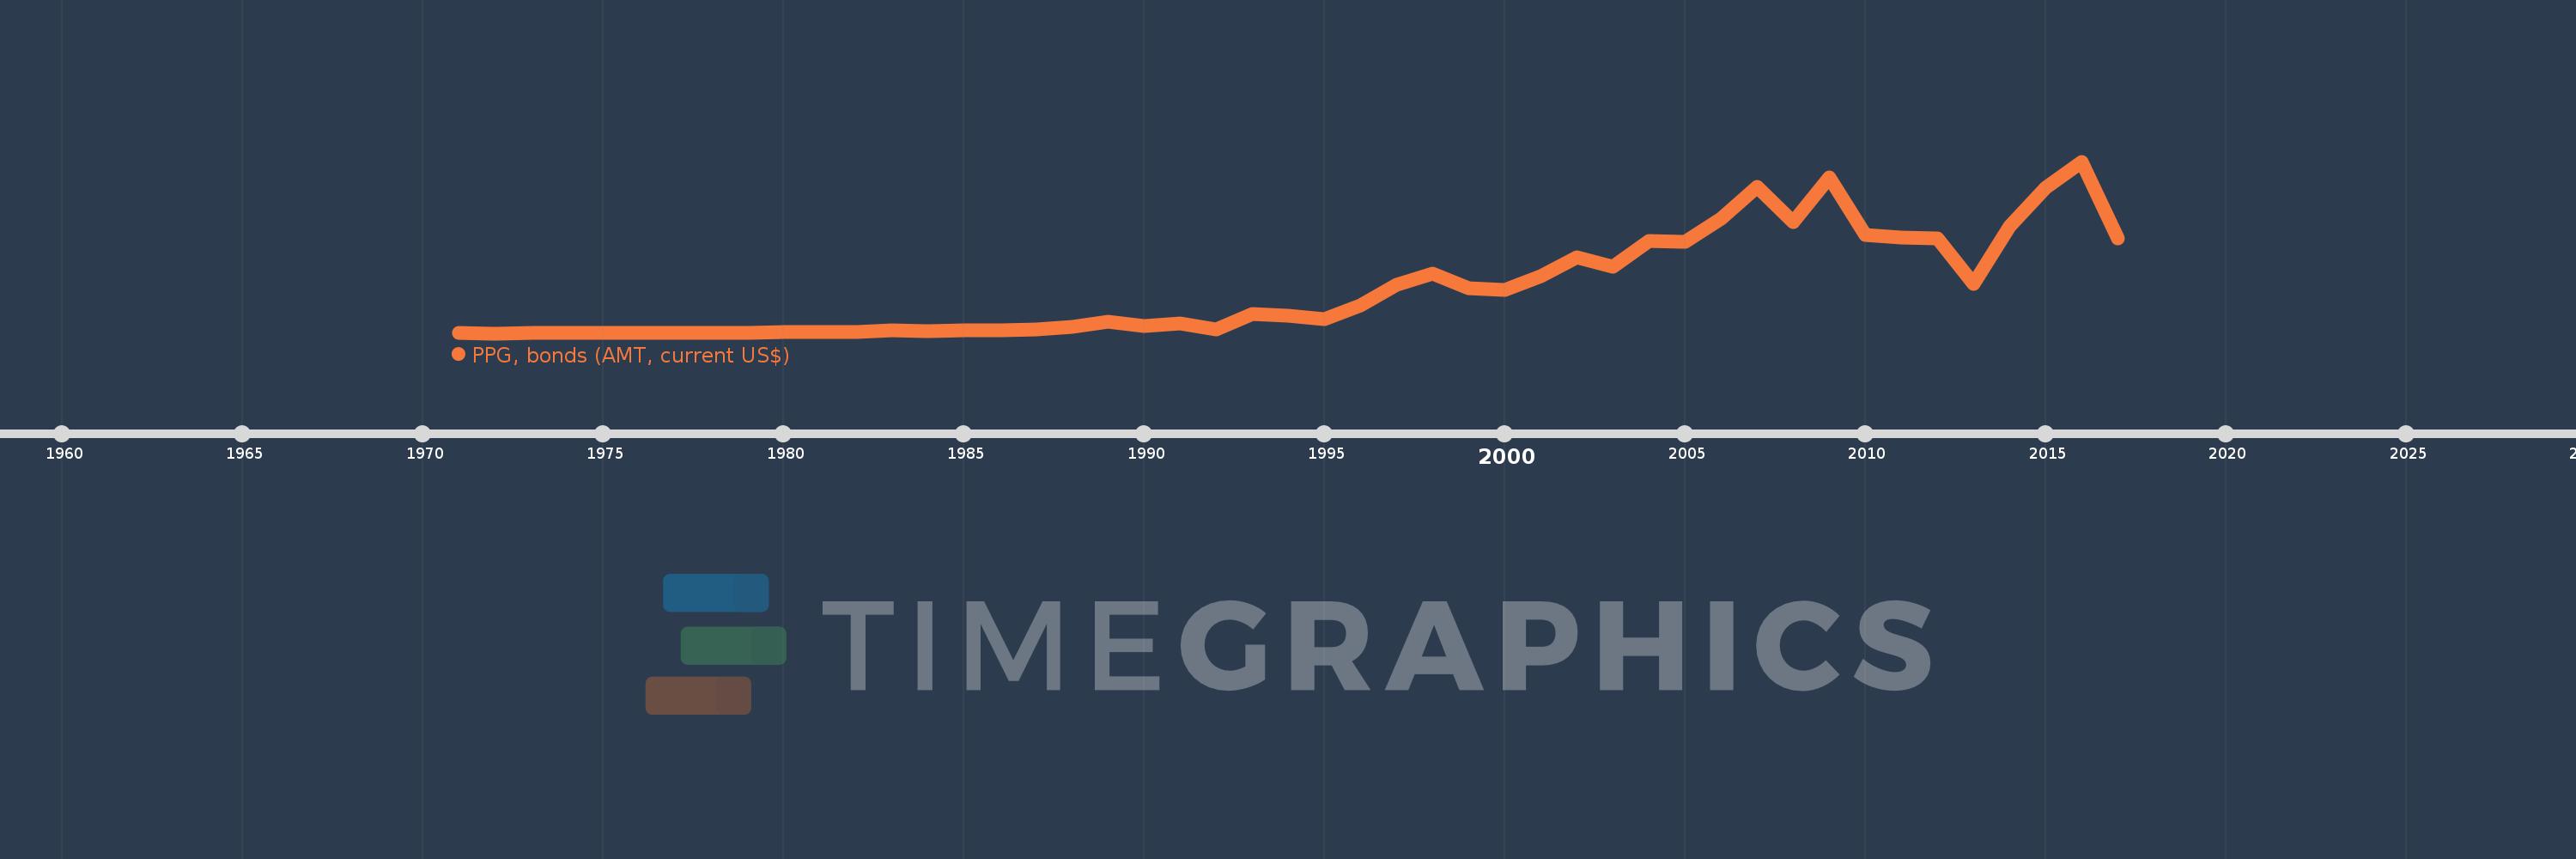
PPG, bonds (AMT, current US$)
2017,2016,2015,2014,2013,2012,2011,2010,2009,2008,2007,2006,2005,2004,2003,2002,2001,2000,1999,1998,1997,1996,1995,1994,1993,1992,1991,1990,1989,1988,1987,1986,1985,1984,1983,1982,1981,1980,1979,1978,1977,1976,1975,1974,1973,1972,1971
Estas estadísticas en otros países:
línea de tiempo (timeline):
En esta escala de tiempo se presenta un gráfico de 1971 y 2017 de Middle income. Los datos de 1970 están ausentes. El número de observaciones reales por fecha: 47.
Fuente (nombre):
Indicadores del desarrollo mundial
Fuente (organización):
World Bank, International Debt Statistics.
Categorías:
External Debt
Se ha actualizado:
23 abr 2017 año
Los indicadores de los cambios de valor en los últimos años
Mínimo:
110.547 millones
1 ene 1972 año
Máximo:
65.701 bn
1 ene 2016 año
A la fecha de observación
Valor
Cambio absoluto
El cambio con respecto al valor anterior
1 ene 1971 año
118.786 millones
+118.786 millones
0.0%
1 ene 1972 año
110.547 millones
-8.239 millones
-6.94%
1 ene 1973 año
220.088 millones
+109.541 millones
99.09%
1 ene 1974 año
298.325 millones
+78.237 millones
35.55%
1 ene 1975 año
260.068 millones
-38.257 millones
-12.82%
1 ene 1976 año
207.248 millones
-52.82 millones
-20.31%
1 ene 1977 año
250.42 millones
+43.172 millones
20.83%
1 ene 1978 año
268.551 millones
+18.131 millones
7.24%
1 ene 1979 año
353.114 millones
+84.563 millones
31.49%
1 ene 1980 año
592.322 millones
+239.208 millones
67.74%
1 ene 1981 año
467.169 millones
-125.153 millones
-21.13%
1 ene 1982 año
518.887 millones
+51.718 millones
11.07%
1 ene 1983 año
1.311 bn
+791.869 millones
152.61%
1 ene 1984 año
1.041 bn
-270.093 millones
-20.61%
1 ene 1985 año
1.315 bn
+274.62 millones
26.39%
1 ene 1986 año
1.333 bn
+17.566 millones
1.34%
1 ene 1987 año
1.719 bn
+386.06 millones
28.97%
1 ene 1988 año
2.599 bn
+879.602 millones
51.17%
1 ene 1989 año
4.415 bn
+1.816 bn
69.89%
1 ene 1990 año
2.854 bn
-1.561 bn
-35.35%
1 ene 1991 año
4.032 bn
+1.178 bn
41.28%
1 ene 1992 año
1.641 bn
-2.391 bn
-59.3%
1 ene 1993 año
7.594 bn
+5.952 bn
362.69%
1 ene 1994 año
6.8 bn
-793.61 millones
-10.45%
1 ene 1995 año
5.547 bn
-1.253 bn
-18.43%
1 ene 1996 año
10.774 bn
+5.227 bn
94.23%
1 ene 1997 año
18.607 bn
+7.833 bn
72.7%
1 ene 1998 año
22.975 bn
+4.368 bn
23.48%
1 ene 1999 año
17.315 bn
-5.66 bn
-24.64%
1 ene 2000 año
16.745 bn
-570.175 millones
-3.29%
1 ene 2001 año
21.95 bn
+5.205 bn
31.09%
1 ene 2002 año
29.021 bn
+7.07 bn
32.21%
1 ene 2003 año
25.639 bn
-3.381 bn
-11.65%
1 ene 2004 año
35.269 bn
+9.629 bn
37.56%
1 ene 2005 año
35.029 bn
-239.863 millones
-0.68%
1 ene 2006 año
43.941 bn
+8.912 bn
25.44%
1 ene 2007 año
56.099 bn
+12.158 bn
27.67%
1 ene 2008 año
42.534 bn
-13.564 bn
-24.18%
1 ene 2009 año
59.633 bn
+17.099 bn
40.2%
1 ene 2010 año
37.634 bn
-21.999 bn
-36.89%
1 ene 2011 año
36.738 bn
-896.395 millones
-2.38%
1 ene 2012 año
36.375 bn
-362.911 millones
-0.99%
1 ene 2013 año
18.957 bn
-17.418 bn
-47.88%
1 ene 2014 año
40.785 bn
+21.828 bn
115.14%
1 ene 2015 año
55.742 bn
+14.956 bn
36.67%
1 ene 2016 año
65.701 bn
+9.959 bn
17.87%
1 ene 2017 año
36.43 bn
-29.271 bn
-44.55%
Ranking de los países por los datos estadísticos actuales


Comentarios: