29
/es/
es
AIzaSyAYiBZKx7MnpbEhh9jyipgxe19OcubqV5w
April 1, 2024
49983
Middle East & North Africa (IDA & IBRD countries)
TMN
false
2
1
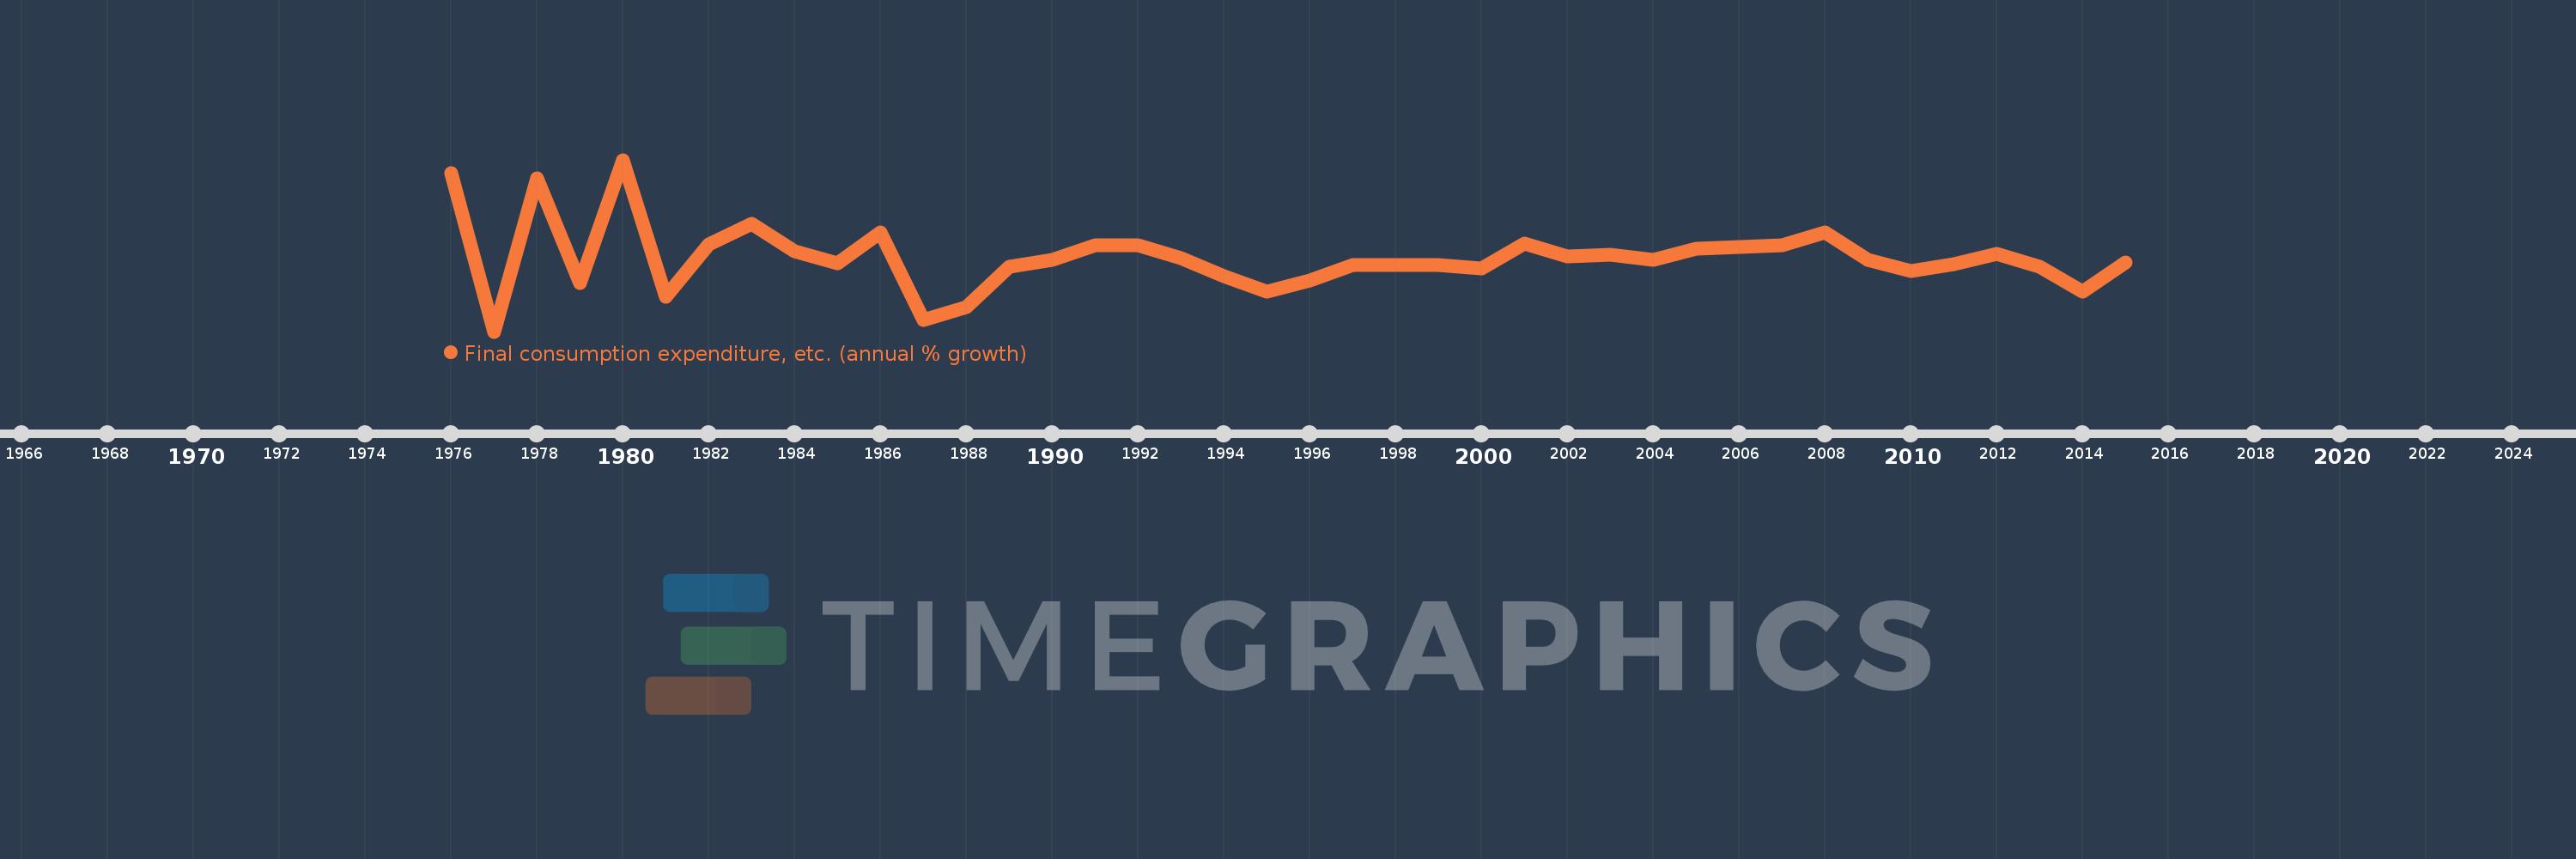
Final consumption expenditure, etc. (annual % growth)
2015,2014,2013,2012,2011,2010,2009,2008,2007,2006,2005,2004,2003,2002,2001,2000,1999,1998,1997,1996,1995,1994,1993,1992,1991,1990,1989,1988,1987,1986,1985,1984,1983,1982,1981,1980,1979,1978,1977,1976
Estas estadísticas en otros países:
AlbaniaAlgeriaAntigua and BarbudaArab WorldArgentinaArmeniaAustraliaAustriaAzerbaijanBahamas, TheBahrainBangladeshBarbadosBelarusBelgiumBelizeBeninBhutanBoliviaBosnia and HerzegovinaBotswanaBrazilBrunei DarussalamBulgariaBurkina FasoBurundiCabo VerdeCambodiaCameroonCanadaCaribbean small statesCentral Europe and the BalticsChadChileColombiaComorosCongo, Dem. Rep.Congo, Rep.Costa RicaCote d'IvoireCroatiaCubaCyprusCzech RepublicDenmarkDjiboutiDominican RepublicEarly-demographic dividendEast Asia & PacificEcuadorEgypt, Arab Rep.El SalvadorEquatorial GuineaEritreaEstoniaEthiopiaEuro areaEurope & Central AsiaEurope & Central Asia (excluding high income)Europe & Central Asia (IDA & IBRD countries)European UnionFijiFinlandFranceGabonGambia, TheGeorgiaGermanyGhanaGreeceGuatemalaGuineaGuinea-BissauHaitiHeavily indebted poor countries (HIPC)High incomeHondurasHong Kong SAR, ChinaHungaryIBRD onlyIcelandIDA & IBRD totalIDA blendIDA onlyIDA totalIndiaIndonesiaIran, Islamic Rep.IrelandIsraelItalyJamaicaJapanJordanKazakhstanKenyaKorea, Rep.KosovoKuwaitKyrgyz RepublicLao PDRLatin America & Caribbean Latin America & Caribbean (excluding high income)Latin America & the Caribbean (IDA & IBRD countries)LatviaLeast developed countries: UN classificationLebanonLiberiaLithuaniaLow & middle incomeLow incomeLower middle incomeLuxembourgMacao SAR, ChinaMacedonia, FYRMadagascarMalawiMalaysiaMaliMaltaMauritaniaMauritiusMexicoMiddle East & North AfricaMiddle East & North Africa (excluding high income)Middle East & North Africa (IDA & IBRD countries)Middle incomeMoldovaMongoliaMontenegroMoroccoMozambiqueNamibiaNepalNetherlandsNew ZealandNicaraguaNigerNigeriaNorth AmericaNorwayOECD membersOmanOther small statesPakistanPanamaPapua New GuineaParaguayPeruPhilippinesPolandPortugalPost-demographic dividendPre-demographic dividendPuerto RicoQatarRomaniaRussian FederationRwandaSaudi ArabiaSenegalSerbiaSeychellesSierra LeoneSingaporeSlovak RepublicSloveniaSmall statesSomaliaSouth AfricaSouth AsiaSouth Asia (IDA & IBRD)South SudanSpainSri LankaSub-Saharan Africa Sub-Saharan Africa (excluding high income)Sub-Saharan Africa (IDA & IBRD countries)SudanSurinameSwazilandSwedenSwitzerlandSyrian Arab RepublicTajikistanTanzaniaThailandTimor-LesteTogoTrinidad and TobagoTunisiaTurkeyTurkmenistanUgandaUkraineUnited Arab EmiratesUnited KingdomUnited StatesUpper middle incomeUruguayUzbekistanVanuatuVenezuela, RBVietnamWest Bank and GazaWorldZimbabwe línea de tiempo (timeline):
En esta escala de tiempo se presenta un gráfico de 1976 y 2015 de Middle East & North Africa (IDA & IBRD countries). Los datos de 1975 están ausentes. El número de observaciones reales por fecha: 40.
Fuente (nombre):
Indicadores del desarrollo mundial
Fuente (organización):
World Bank national accounts data, and OECD National Accounts data files.
Categorías:
Economy & Growth
Se ha actualizado:
23 abr 2017 año
Los indicadores de los cambios de valor en los últimos años
Mínimo:
-6.327
1 ene 1977 año
Máximo:
17.907
1 ene 1980 año
A la fecha de observación
Valor
Cambio absoluto
El cambio con respecto al valor anterior
1 ene 1976 año
16.007
+16.007
0.0%
1 ene 1977 año
-6.327
-22.335
-139.53%
1 ene 1978 año
15.278
+21.606
-341.46%
1 ene 1979 año
0.463
-14.815
-96.97%
1 ene 1980 año
17.907
+17.444
3.77 mil%
1 ene 1981 año
-1.433
-19.34
-108.0%
1 ene 1982 año
5.984
+7.417
-517.61%
1 ene 1983 año
8.904
+2.919
48.78%
1 ene 1984 año
5.012
-3.892
-43.71%
1 ene 1985 año
3.248
-1.764
-35.19%
1 ene 1986 año
7.709
+4.461
137.31%
1 ene 1987 año
-4.709
-12.418
-161.09%
1 ene 1988 año
-2.899
+1.81
-38.43%
1 ene 1989 año
2.869
+5.769
-198.96%
1 ene 1990 año
3.742
+0.873
30.43%
1 ene 1991 año
5.836
+2.093
55.94%
1 ene 1992 año
5.806
-0.03
-0.51%
1 ene 1993 año
4.066
-1.739
-29.96%
1 ene 1994 año
1.431
-2.635
-64.81%
1 ene 1995 año
-0.642
-2.073
-144.84%
1 ene 1996 año
0.897
+1.539
-239.84%
1 ene 1997 año
3.047
+2.15
239.59%
1 ene 1998 año
3.08
+0.033
1.07%
1 ene 1999 año
3.08
+0.001
0.02%
1 ene 2000 año
2.593
-0.487
-15.82%
1 ene 2001 año
6.071
+3.479
134.16%
1 ene 2002 año
4.334
-1.737
-28.61%
1 ene 2003 año
4.546
+0.212
4.9%
1 ene 2004 año
3.818
-0.729
-16.03%
1 ene 2005 año
5.332
+1.515
39.68%
1 ene 2006 año
5.6
+0.267
5.01%
1 ene 2007 año
5.885
+0.285
5.09%
1 ene 2008 año
7.682
+1.797
30.54%
1 ene 2009 año
3.733
-3.949
-51.41%
1 ene 2010 año
2.251
-1.481
-39.69%
1 ene 2011 año
3.164
+0.913
40.54%
1 ene 2012 año
4.675
+1.512
47.78%
1 ene 2013 año
2.768
-1.907
-40.8%
1 ene 2014 año
-0.715
-3.483
-125.83%
1 ene 2015 año
3.455
+4.17
-583.35%
Ranking de los países por los datos estadísticos actuales


Comentarios: