29
/es/
es
AIzaSyAYiBZKx7MnpbEhh9jyipgxe19OcubqV5w
April 1, 2024
48755
Middle East & North Africa (excluding high income)
MNA
false
2
1
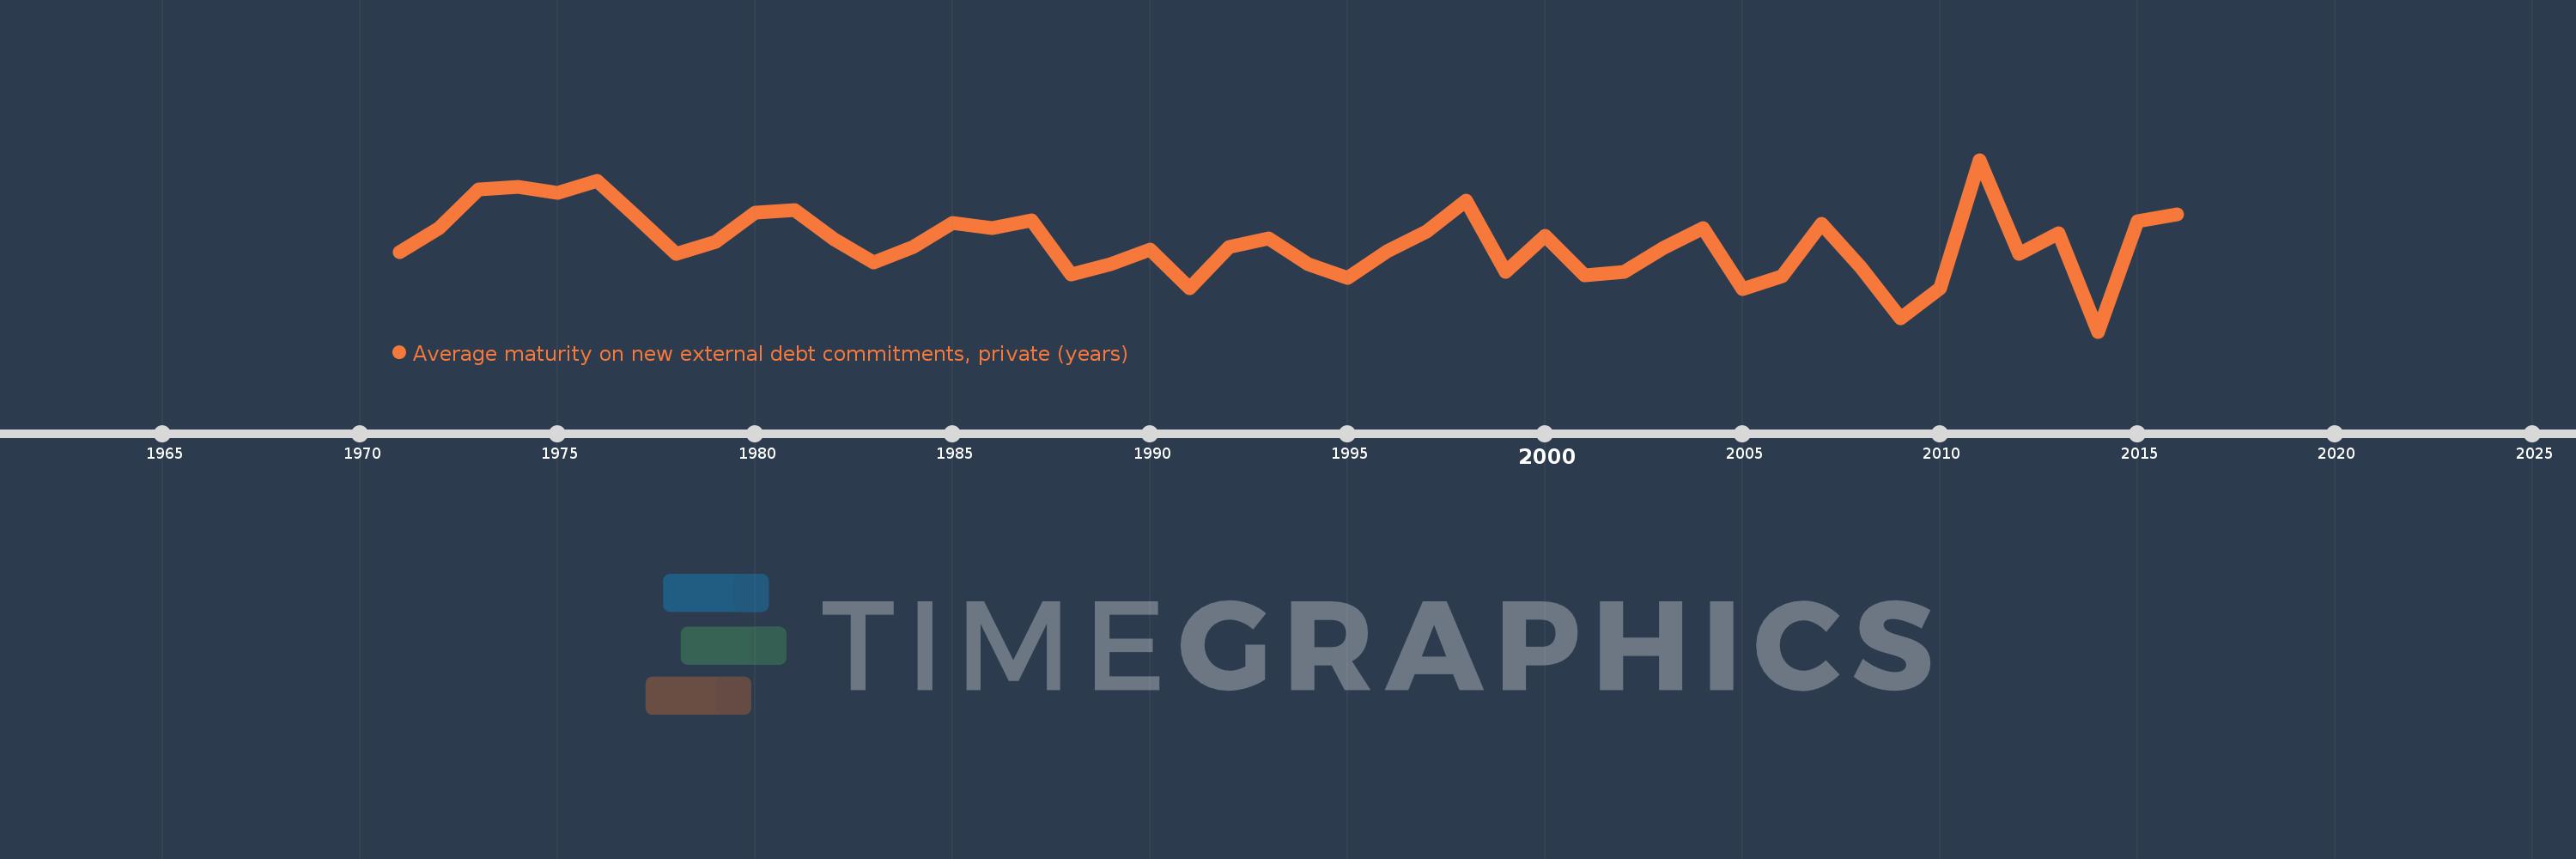
Average maturity on new external debt commitments, private (years)
2016,2015,2014,2013,2012,2011,2010,2009,2008,2007,2006,2005,2004,2003,2002,2001,2000,1999,1998,1997,1996,1995,1994,1993,1992,1991,1990,1989,1988,1987,1986,1985,1984,1983,1982,1981,1980,1979,1978,1977,1976,1975,1974,1973,1972,1971
Estas estadísticas en otros países:
línea de tiempo (timeline):
En esta escala de tiempo se presenta un gráfico de 1971 y 2016 de Middle East & North Africa (excluding high income). Los datos de 1970 están ausentes. El número de observaciones reales por fecha: 46.
Fuente (nombre):
Indicadores del desarrollo mundial
Fuente (organización):
World Bank, International Debt Statistics.
Categorías:
External Debt
Se ha actualizado:
23 abr 2017 año
Los indicadores de los cambios de valor en los últimos años
Mínimo:
5.144
1 ene 2014 año
Máximo:
14.367
1 ene 2011 año
A la fecha de observación
Valor
Cambio absoluto
El cambio con respecto al valor anterior
1 ene 1971 año
9.394
+9.394
0.0%
1 ene 1972 año
10.707
+1.313
13.97%
1 ene 1973 año
12.788
+2.081
19.44%
1 ene 1974 año
12.93
+0.142
1.11%
1 ene 1975 año
12.614
-0.316
-2.44%
1 ene 1976 año
13.258
+0.644
5.1%
1 ene 1977 año
11.309
-1.949
-14.7%
1 ene 1978 año
9.332
-1.977
-17.48%
1 ene 1979 año
9.982
+0.65
6.97%
1 ene 1980 año
11.528
+1.546
15.49%
1 ene 1981 año
11.653
+0.125
1.08%
1 ene 1982 año
10.117
-1.536
-13.18%
1 ene 1983 año
8.878
-1.239
-12.25%
1 ene 1984 año
9.698
+0.819
9.23%
1 ene 1985 año
10.972
+1.275
13.14%
1 ene 1986 año
10.696
-0.276
-2.52%
1 ene 1987 año
11.136
+0.44
4.11%
1 ene 1988 año
8.2
-2.935
-26.36%
1 ene 1989 año
8.744
+0.543
6.62%
1 ene 1990 año
9.541
+0.798
9.12%
1 ene 1991 año
7.486
-2.055
-21.54%
1 ene 1992 año
9.709
+2.223
29.69%
1 ene 1993 año
10.153
+0.445
4.58%
1 ene 1994 año
8.782
-1.371
-13.51%
1 ene 1995 año
8.033
-0.749
-8.52%
1 ene 1996 año
9.468
+1.434
17.85%
1 ene 1997 año
10.519
+1.051
11.1%
1 ene 1998 año
12.168
+1.649
15.68%
1 ene 1999 año
8.337
-3.831
-31.49%
1 ene 2000 año
10.275
+1.939
23.26%
1 ene 2001 año
8.181
-2.095
-20.38%
1 ene 2002 año
8.355
+0.174
2.13%
1 ene 2003 año
9.659
+1.304
15.61%
1 ene 2004 año
10.686
+1.027
10.64%
1 ene 2005 año
7.424
-3.262
-30.53%
1 ene 2006 año
8.111
+0.687
9.25%
1 ene 2007 año
10.941
+2.83
34.89%
1 ene 2008 año
8.566
-2.375
-21.71%
1 ene 2009 año
5.872
-2.694
-31.45%
1 ene 2010 año
7.454
+1.583
26.95%
1 ene 2011 año
14.367
+6.913
92.73%
1 ene 2012 año
9.328
-5.039
-35.07%
1 ene 2013 año
10.441
+1.113
11.93%
1 ene 2014 año
5.144
-5.297
-50.73%
1 ene 2015 año
11.088
+5.944
115.54%
1 ene 2016 año
11.437
+0.349
3.15%
Ranking de los países por los datos estadísticos actuales


Comentarios: