29
/es/
es
AIzaSyAYiBZKx7MnpbEhh9jyipgxe19OcubqV5w
April 1, 2024
47224
Lower middle income
LMC
false
2
1
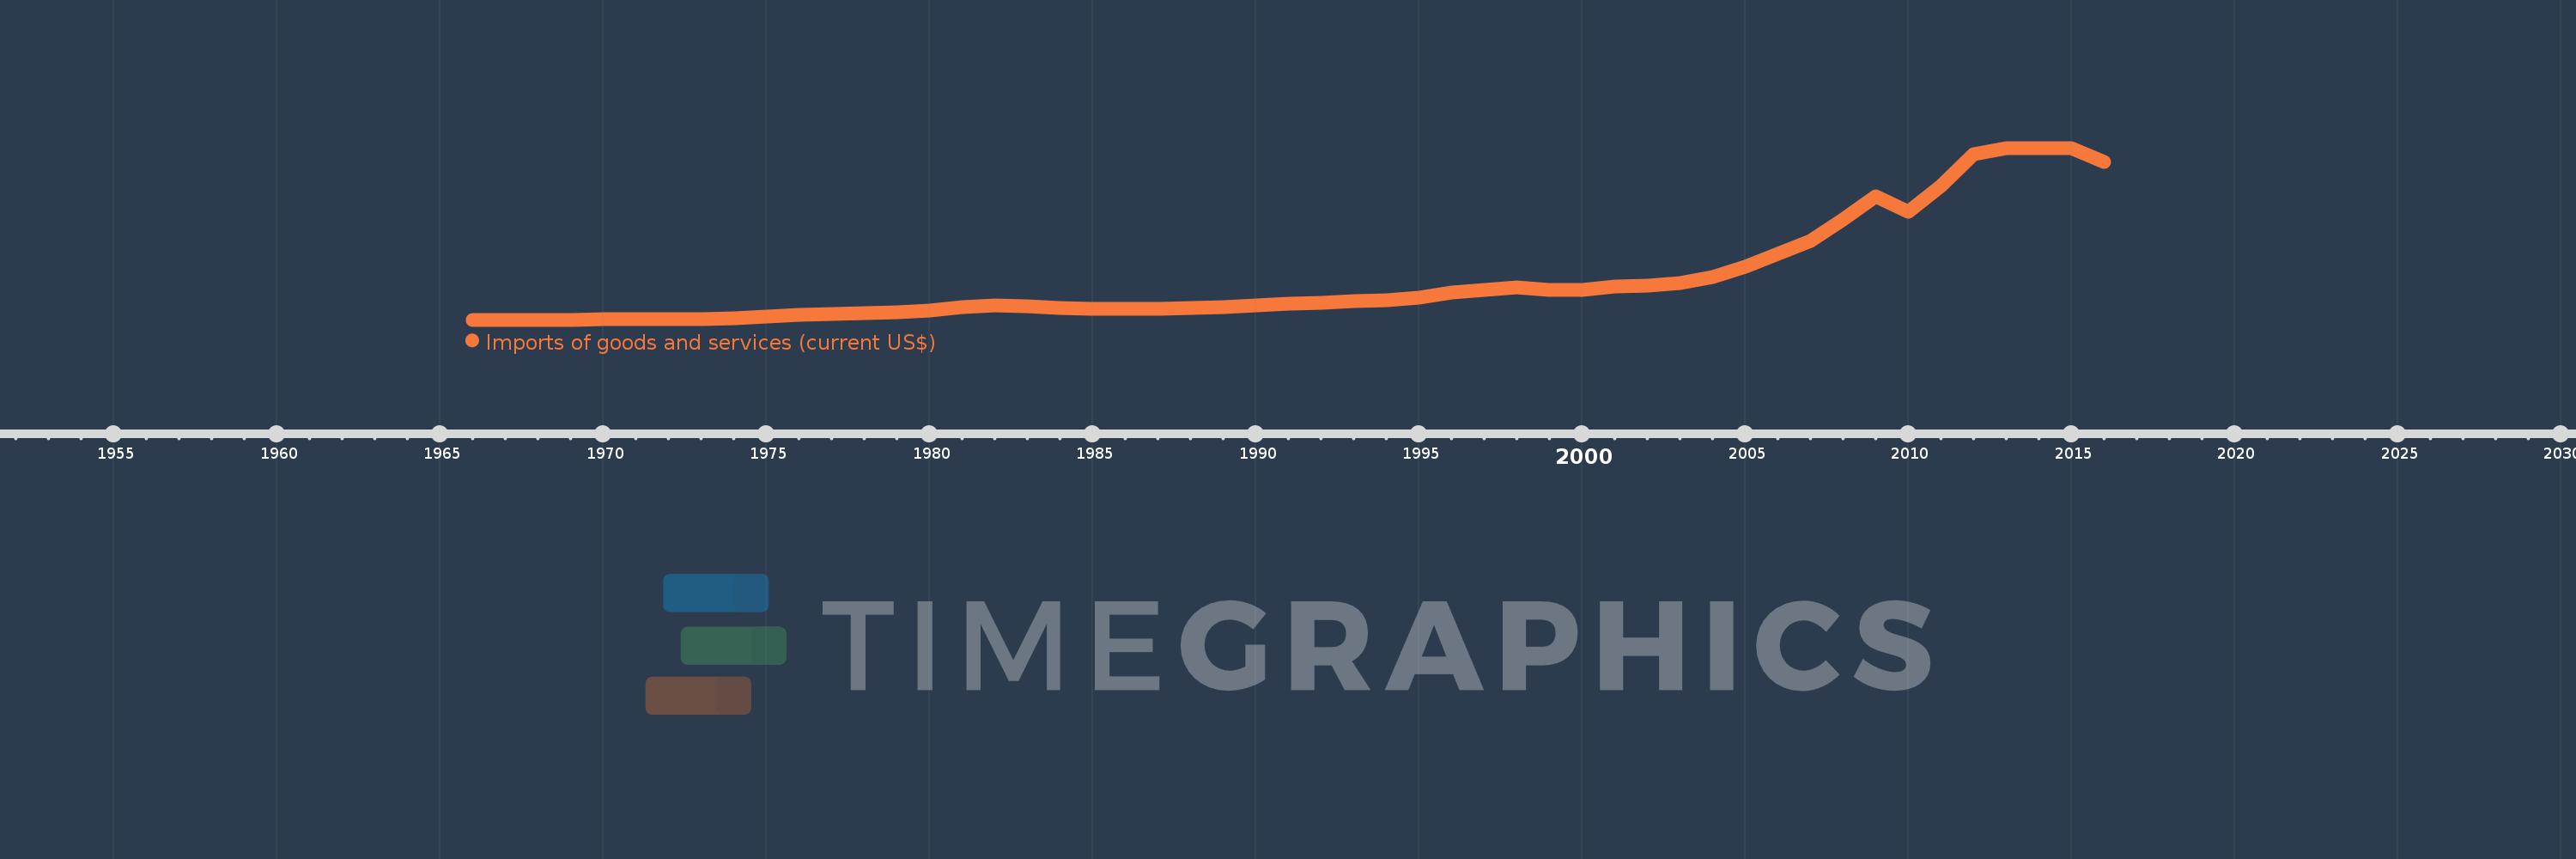
Imports of goods and services (current US$)
2016,2015,2014,2013,2012,2011,2010,2009,2008,2007,2006,2005,2004,2003,2002,2001,2000,1999,1998,1997,1996,1995,1994,1993,1992,1991,1990,1989,1988,1987,1986,1985,1984,1983,1982,1981,1980,1979,1978,1977,1976,1975,1974,1973,1972,1971,1970,1969,1968,1967,1966
Estas estadísticas en otros países:
AfghanistanAlbaniaAlgeriaAngolaAntigua and BarbudaArab WorldArgentinaArmeniaArubaAustraliaAustriaAzerbaijanBahamas, TheBahrainBangladeshBarbadosBelarusBelgiumBelizeBeninBermudaBhutanBoliviaBosnia and HerzegovinaBotswanaBrazilBrunei DarussalamBulgariaBurkina FasoBurundiCabo VerdeCambodiaCameroonCanadaCaribbean small statesCentral African RepublicCentral Europe and the BalticsChadChileChinaColombiaComorosCongo, Dem. Rep.Congo, Rep.Costa RicaCote d'IvoireCroatiaCubaCyprusCzech RepublicDenmarkDjiboutiDominicaDominican RepublicEarly-demographic dividendEast Asia & PacificEast Asia & Pacific (excluding high income)East Asia & Pacific (IDA & IBRD countries)EcuadorEgypt, Arab Rep.El SalvadorEquatorial GuineaEritreaEstoniaEthiopiaEuro areaEurope & Central AsiaEurope & Central Asia (excluding high income)Europe & Central Asia (IDA & IBRD countries)European UnionFaroe IslandsFijiFinlandFragile and conflict affected situationsFranceFrench PolynesiaGabonGambia, TheGeorgiaGermanyGhanaGreeceGrenadaGuatemalaGuineaGuinea-BissauGuyanaHaitiHeavily indebted poor countries (HIPC)High incomeHondurasHong Kong SAR, ChinaHungaryIBRD onlyIcelandIDA & IBRD totalIDA blendIDA onlyIDA totalIndiaIndonesiaIran, Islamic Rep.IraqIrelandIsraelItalyJamaicaJapanJordanKazakhstanKenyaKiribatiKorea, Rep.KosovoKuwaitKyrgyz RepublicLao PDRLate-demographic dividendLatin America & Caribbean Latin America & Caribbean (excluding high income)Latin America & the Caribbean (IDA & IBRD countries)LatviaLeast developed countries: UN classificationLebanonLesothoLiberiaLibyaLithuaniaLow & middle incomeLow incomeLower middle incomeLuxembourgMacao SAR, ChinaMacedonia, FYRMadagascarMalawiMalaysiaMaldivesMaliMaltaMauritaniaMauritiusMexicoMicronesia, Fed. Sts.Middle East & North AfricaMiddle East & North Africa (excluding high income)Middle East & North Africa (IDA & IBRD countries)Middle incomeMoldovaMongoliaMontenegroMoroccoMozambiqueMyanmarNamibiaNepalNetherlandsNew CaledoniaNew ZealandNicaraguaNigerNigeriaNorth AmericaNorwayOECD membersOmanOther small statesPacific island small statesPakistanPalauPanamaPapua New GuineaParaguayPeruPhilippinesPolandPortugalPost-demographic dividendPre-demographic dividendPuerto RicoQatarRomaniaRussian FederationRwandaSamoaSaudi ArabiaSenegalSerbiaSeychellesSierra LeoneSingaporeSlovak RepublicSloveniaSmall statesSolomon IslandsSomaliaSouth AfricaSouth AsiaSouth Asia (IDA & IBRD)South SudanSpainSri LankaSt. Kitts and NevisSt. LuciaSt. Vincent and the GrenadinesSub-Saharan Africa Sub-Saharan Africa (excluding high income)Sub-Saharan Africa (IDA & IBRD countries)SudanSurinameSwazilandSwedenSwitzerlandSyrian Arab RepublicTajikistanTanzaniaThailandTimor-LesteTogoTongaTrinidad and TobagoTunisiaTurkeyTurkmenistanUgandaUkraineUnited Arab EmiratesUnited KingdomUnited StatesUpper middle incomeUruguayUzbekistanVanuatuVenezuela, RBVietnamWest Bank and GazaWorldYemen, Rep.ZambiaZimbabwe línea de tiempo (timeline):
En esta escala de tiempo se presenta un gráfico de 1966 y 2016 de Lower middle income. Los datos de 1965 están ausentes. El número de observaciones reales por fecha: 51.
Fuente (nombre):
Indicadores del desarrollo mundial
Fuente (organización):
World Bank national accounts data, and OECD National Accounts data files.
Categorías:
Economy & Growth, Trade
Se ha actualizado:
23 abr 2017 año
Los indicadores de los cambios de valor en los últimos años
Mínimo:
17.213 bn
1 ene 1966 año
Máximo:
1.702 billones
1 ene 2015 año
A la fecha de observación
Valor
Cambio absoluto
El cambio con respecto al valor anterior
1 ene 1966 año
17.213 bn
+17.213 bn
0.0%
1 ene 1967 año
17.588 bn
+375.115 millones
2.18%
1 ene 1968 año
18.088 bn
+500.161 millones
2.84%
1 ene 1969 año
18.007 bn
-80.94 millones
-0.45%
1 ene 1970 año
18.966 bn
+958.497 millones
5.32%
1 ene 1971 año
21.805 bn
+2.839 bn
14.97%
1 ene 1972 año
22.788 bn
+983.093 millones
4.51%
1 ene 1973 año
24.517 bn
+1.73 bn
7.59%
1 ene 1974 año
32.04 bn
+7.523 bn
30.68%
1 ene 1975 año
51.918 bn
+19.878 bn
62.04%
1 ene 1976 año
64.571 bn
+12.653 bn
24.37%
1 ene 1977 año
72.236 bn
+7.665 bn
11.87%
1 ene 1978 año
79.715 bn
+7.479 bn
10.35%
1 ene 1979 año
90.036 bn
+10.321 bn
12.95%
1 ene 1980 año
111.391 bn
+21.355 bn
23.72%
1 ene 1981 año
141.459 bn
+30.068 bn
26.99%
1 ene 1982 año
158.605 bn
+17.146 bn
12.12%
1 ene 1983 año
146.763 bn
-11.842 bn
-7.47%
1 ene 1984 año
136.731 bn
-10.032 bn
-6.84%
1 ene 1985 año
127.428 bn
-9.303 bn
-6.8%
1 ene 1986 año
125.742 bn
-1.686 bn
-1.32%
1 ene 1987 año
121.542 bn
-4.201 bn
-3.34%
1 ene 1988 año
133.488 bn
+11.946 bn
9.83%
1 ene 1989 año
144.779 bn
+11.291 bn
8.46%
1 ene 1990 año
156.423 bn
+11.644 bn
8.04%
1 ene 1991 año
178.149 bn
+21.726 bn
13.89%
1 ene 1992 año
180.047 bn
+1.898 bn
1.07%
1 ene 1993 año
199.522 bn
+19.475 bn
10.82%
1 ene 1994 año
207.868 bn
+8.346 bn
4.18%
1 ene 1995 año
230.931 bn
+23.062 bn
11.09%
1 ene 1996 año
287.095 bn
+56.164 bn
24.32%
1 ene 1997 año
313.017 bn
+25.923 bn
9.03%
1 ene 1998 año
336.086 bn
+23.068 bn
7.37%
1 ene 1999 año
308.396 bn
-27.69 bn
-8.24%
1 ene 2000 año
309.909 bn
+1.513 bn
0.49%
1 ene 2001 año
342.926 bn
+33.017 bn
10.65%
1 ene 2002 año
353.932 bn
+11.005 bn
3.21%
1 ene 2003 año
379.942 bn
+26.011 bn
7.35%
1 ene 2004 año
437.059 bn
+57.116 bn
15.03%
1 ene 2005 año
537.568 bn
+100.509 bn
23.0%
1 ene 2006 año
662.007 bn
+124.439 bn
23.15%
1 ene 2007 año
792.443 bn
+130.437 bn
19.7%
1 ene 2008 año
1.001 billones
+208.686 bn
26.33%
1 ene 2009 año
1.224 billones
+223.286 bn
22.3%
1 ene 2010 año
1.073 billones
-151.835 bn
-12.4%
1 ene 2011 año
1.329 billones
+256.108 bn
23.88%
1 ene 2012 año
1.643 billones
+314.154 bn
23.64%
1 ene 2013 año
1.699 billones
+56.553 bn
3.44%
1 ene 2014 año
1.699 billones
-573.495 millones
-0.03%
1 ene 2015 año
1.702 billones
+3.592 bn
0.21%
1 ene 2016 año
1.567 billones
-135.568 bn
-7.96%
Ranking de los países por los datos estadísticos actuales


Comentarios: