29
/es/
es
AIzaSyAYiBZKx7MnpbEhh9jyipgxe19OcubqV5w
April 1, 2024
46109
Low income
LIC
false
2
1
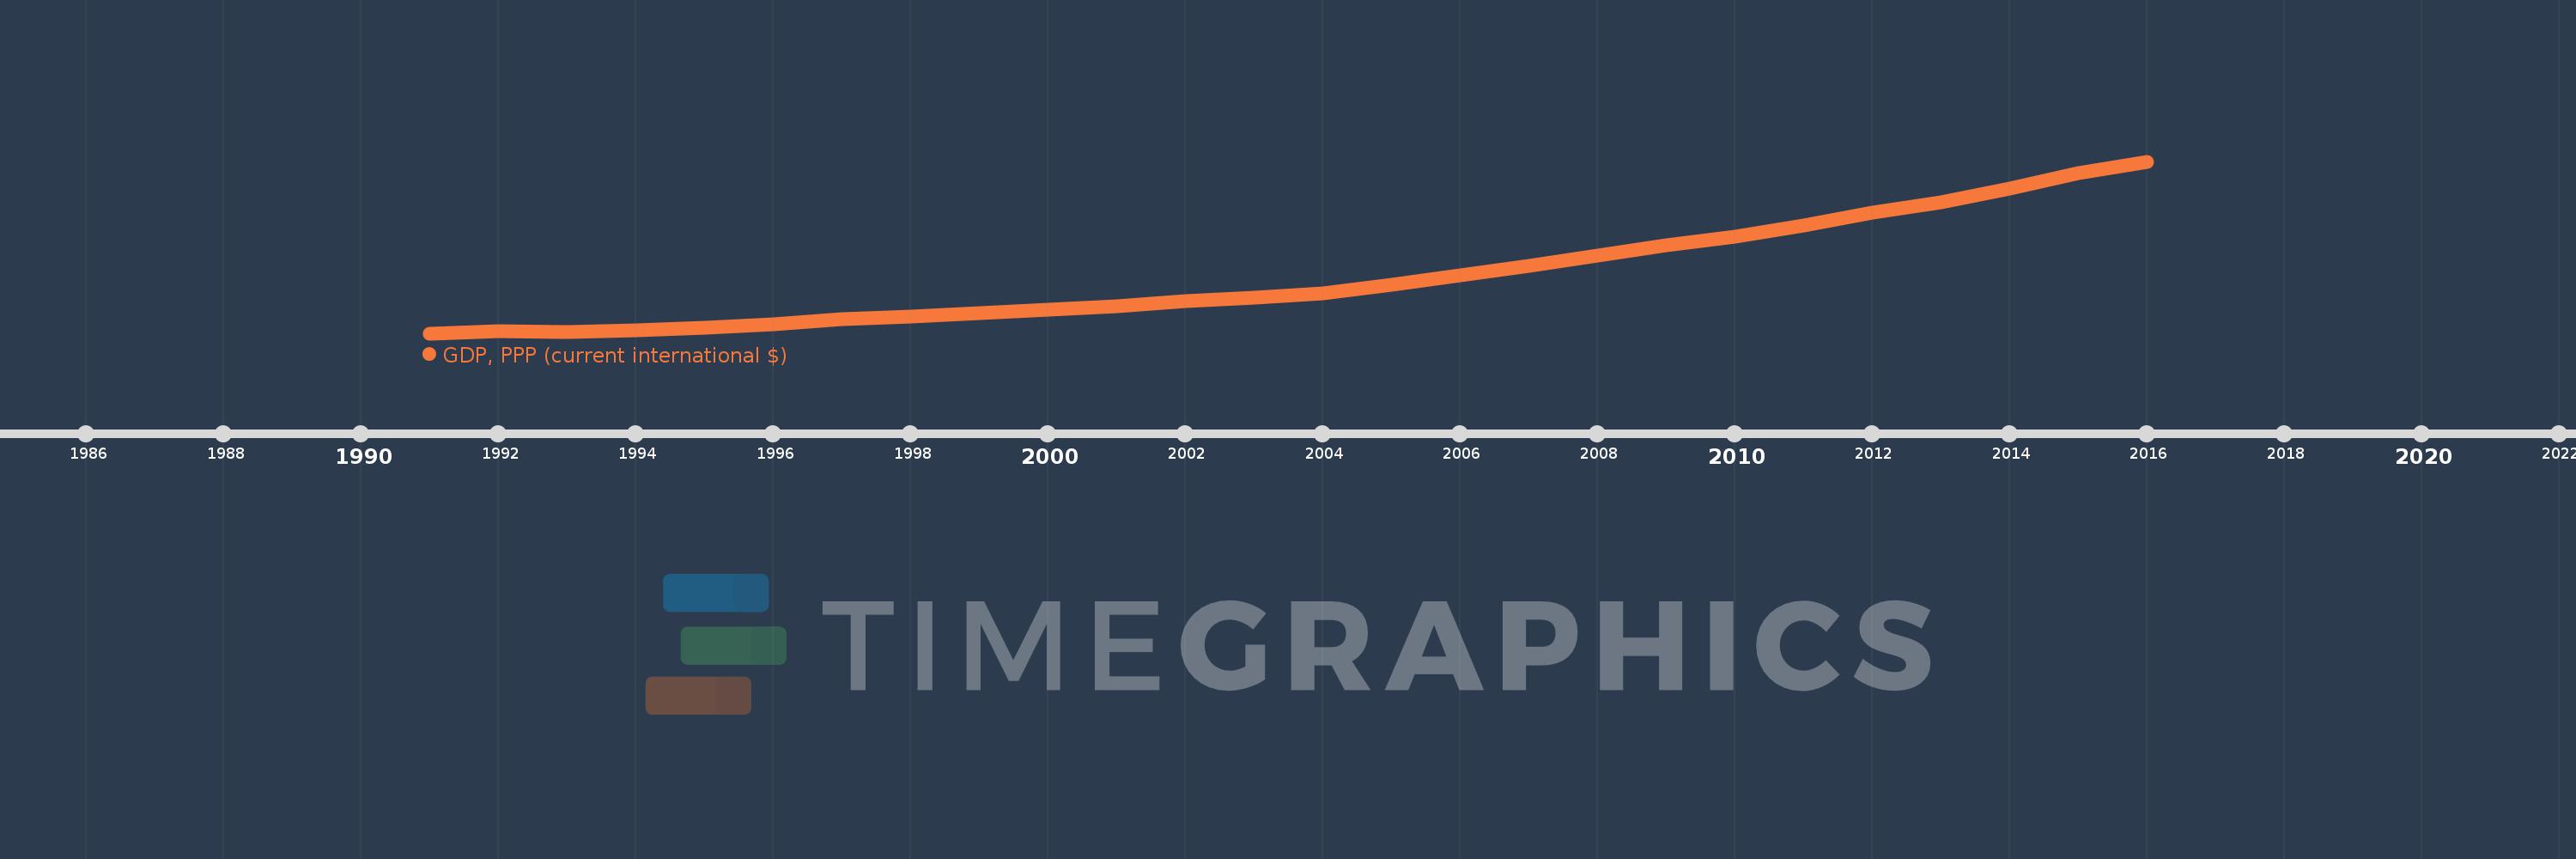
GDP, PPP (current international $)
2016,2015,2014,2013,2012,2011,2010,2009,2008,2007,2006,2005,2004,2003,2002,2001,2000,1999,1998,1997,1996,1995,1994,1993,1992,1991
Estas estadísticas en otros países:
AfghanistanAlbaniaAlgeriaAngolaAntigua and BarbudaArab WorldArgentinaArmeniaArubaAustraliaAustriaAzerbaijanBahamas, TheBahrainBangladeshBarbadosBelarusBelgiumBelizeBeninBermudaBhutanBoliviaBosnia and HerzegovinaBotswanaBrazilBrunei DarussalamBulgariaBurkina FasoBurundiCabo VerdeCambodiaCameroonCanadaCaribbean small statesCayman IslandsCentral African RepublicCentral Europe and the BalticsChadChileChinaColombiaComorosCongo, Dem. Rep.Congo, Rep.Costa RicaCote d'IvoireCroatiaCubaCyprusCzech RepublicDenmarkDjiboutiDominicaDominican RepublicEarly-demographic dividendEast Asia & PacificEast Asia & Pacific (excluding high income)East Asia & Pacific (IDA & IBRD countries)EcuadorEgypt, Arab Rep.El SalvadorEquatorial GuineaEritreaEstoniaEthiopiaEuro areaEurope & Central AsiaEurope & Central Asia (excluding high income)Europe & Central Asia (IDA & IBRD countries)European UnionFijiFinlandFragile and conflict affected situationsFranceGabonGambia, TheGeorgiaGermanyGhanaGreeceGrenadaGuatemalaGuineaGuinea-BissauGuyanaHaitiHeavily indebted poor countries (HIPC)High incomeHondurasHong Kong SAR, ChinaHungaryIBRD onlyIcelandIDA & IBRD totalIDA blendIDA onlyIDA totalIndiaIndonesiaIran, Islamic Rep.IraqIrelandIsraelItalyJamaicaJapanJordanKazakhstanKenyaKiribatiKorea, Rep.KosovoKuwaitKyrgyz RepublicLao PDRLate-demographic dividendLatin America & Caribbean Latin America & Caribbean (excluding high income)Latin America & the Caribbean (IDA & IBRD countries)LatviaLeast developed countries: UN classificationLebanonLesothoLiberiaLibyaLithuaniaLow & middle incomeLow incomeLower middle incomeLuxembourgMacao SAR, ChinaMacedonia, FYRMadagascarMalawiMalaysiaMaldivesMaliMaltaMarshall IslandsMauritaniaMauritiusMexicoMicronesia, Fed. Sts.Middle East & North AfricaMiddle East & North Africa (excluding high income)Middle East & North Africa (IDA & IBRD countries)Middle incomeMoldovaMongoliaMontenegroMoroccoMozambiqueMyanmarNamibiaNauruNepalNetherlandsNew ZealandNicaraguaNigerNigeriaNorth AmericaNorwayOECD membersOmanOther small statesPacific island small statesPakistanPalauPanamaPapua New GuineaParaguayPeruPhilippinesPolandPortugalPost-demographic dividendPre-demographic dividendPuerto RicoQatarRomaniaRussian FederationRwandaSamoaSao Tome and PrincipeSaudi ArabiaSenegalSerbiaSeychellesSierra LeoneSingaporeSint Maarten (Dutch part)Slovak RepublicSloveniaSmall statesSolomon IslandsSouth AfricaSouth AsiaSouth Asia (IDA & IBRD)South SudanSpainSri LankaSt. Kitts and NevisSt. LuciaSt. Vincent and the GrenadinesSub-Saharan Africa Sub-Saharan Africa (excluding high income)Sub-Saharan Africa (IDA & IBRD countries)SudanSurinameSwazilandSwedenSwitzerlandTajikistanTanzaniaThailandTimor-LesteTogoTongaTrinidad and TobagoTunisiaTurkeyTurkmenistanTuvaluUgandaUkraineUnited Arab EmiratesUnited KingdomUnited StatesUpper middle incomeUruguayUzbekistanVanuatuVenezuela, RBVietnamWest Bank and GazaWorldYemen, Rep.ZambiaZimbabwe línea de tiempo (timeline):
En esta escala de tiempo se presenta un gráfico de 1991 y 2016 de Low income. Los datos de 1990 están ausentes. El número de observaciones reales por fecha: 26.
Fuente (nombre):
Indicadores del desarrollo mundial
Fuente (organización):
World Bank, International Comparison Program database.
Categorías:
Economy & Growth
Se ha actualizado:
23 abr 2017 año
Los indicadores de los cambios de valor en los últimos años
Mínimo:
238.029 bn
1 ene 1991 año
Máximo:
1.044 billones
1 ene 2016 año
A la fecha de observación
Valor
Cambio absoluto
El cambio con respecto al valor anterior
1 ene 1991 año
238.029 bn
+238.029 bn
0.0%
1 ene 1992 año
247.548 bn
+9.519 bn
4.0%
1 ene 1993 año
245.706 bn
-1.842 bn
-0.74%
1 ene 1994 año
253.755 bn
+8.049 bn
3.28%
1 ene 1995 año
264.177 bn
+10.422 bn
4.11%
1 ene 1996 año
280.186 bn
+16.009 bn
6.06%
1 ene 1997 año
302.632 bn
+22.446 bn
8.01%
1 ene 1998 año
318.449 bn
+15.817 bn
5.23%
1 ene 1999 año
331.291 bn
+12.842 bn
4.03%
1 ene 2000 año
348.161 bn
+16.87 bn
5.09%
1 ene 2001 año
364.417 bn
+16.255 bn
4.67%
1 ene 2002 año
391.117 bn
+26.7 bn
7.33%
1 ene 2003 año
405.516 bn
+14.399 bn
3.68%
1 ene 2004 año
427.416 bn
+21.9 bn
5.4%
1 ene 2005 año
464.599 bn
+37.184 bn
8.7%
1 ene 2006 año
509.454 bn
+44.855 bn
9.65%
1 ene 2007 año
552.831 bn
+43.377 bn
8.51%
1 ene 2008 año
604.5 bn
+51.67 bn
9.35%
1 ene 2009 año
649.234 bn
+44.733 bn
7.4%
1 ene 2010 año
690.125 bn
+40.891 bn
6.3%
1 ene 2011 año
744.543 bn
+54.418 bn
7.89%
1 ene 2012 año
803.98 bn
+59.437 bn
7.98%
1 ene 2013 año
850.8 bn
+46.82 bn
5.82%
1 ene 2014 año
915.576 bn
+64.776 bn
7.61%
1 ene 2015 año
988.781 bn
+73.204 bn
8.0%
1 ene 2016 año
1.044 billones
+55.419 bn
5.6%
Ranking de los países por los datos estadísticos actuales


Comentarios: