29
/es/
es
AIzaSyAYiBZKx7MnpbEhh9jyipgxe19OcubqV5w
April 1, 2024
45980
Low income
LIC
false
2
1
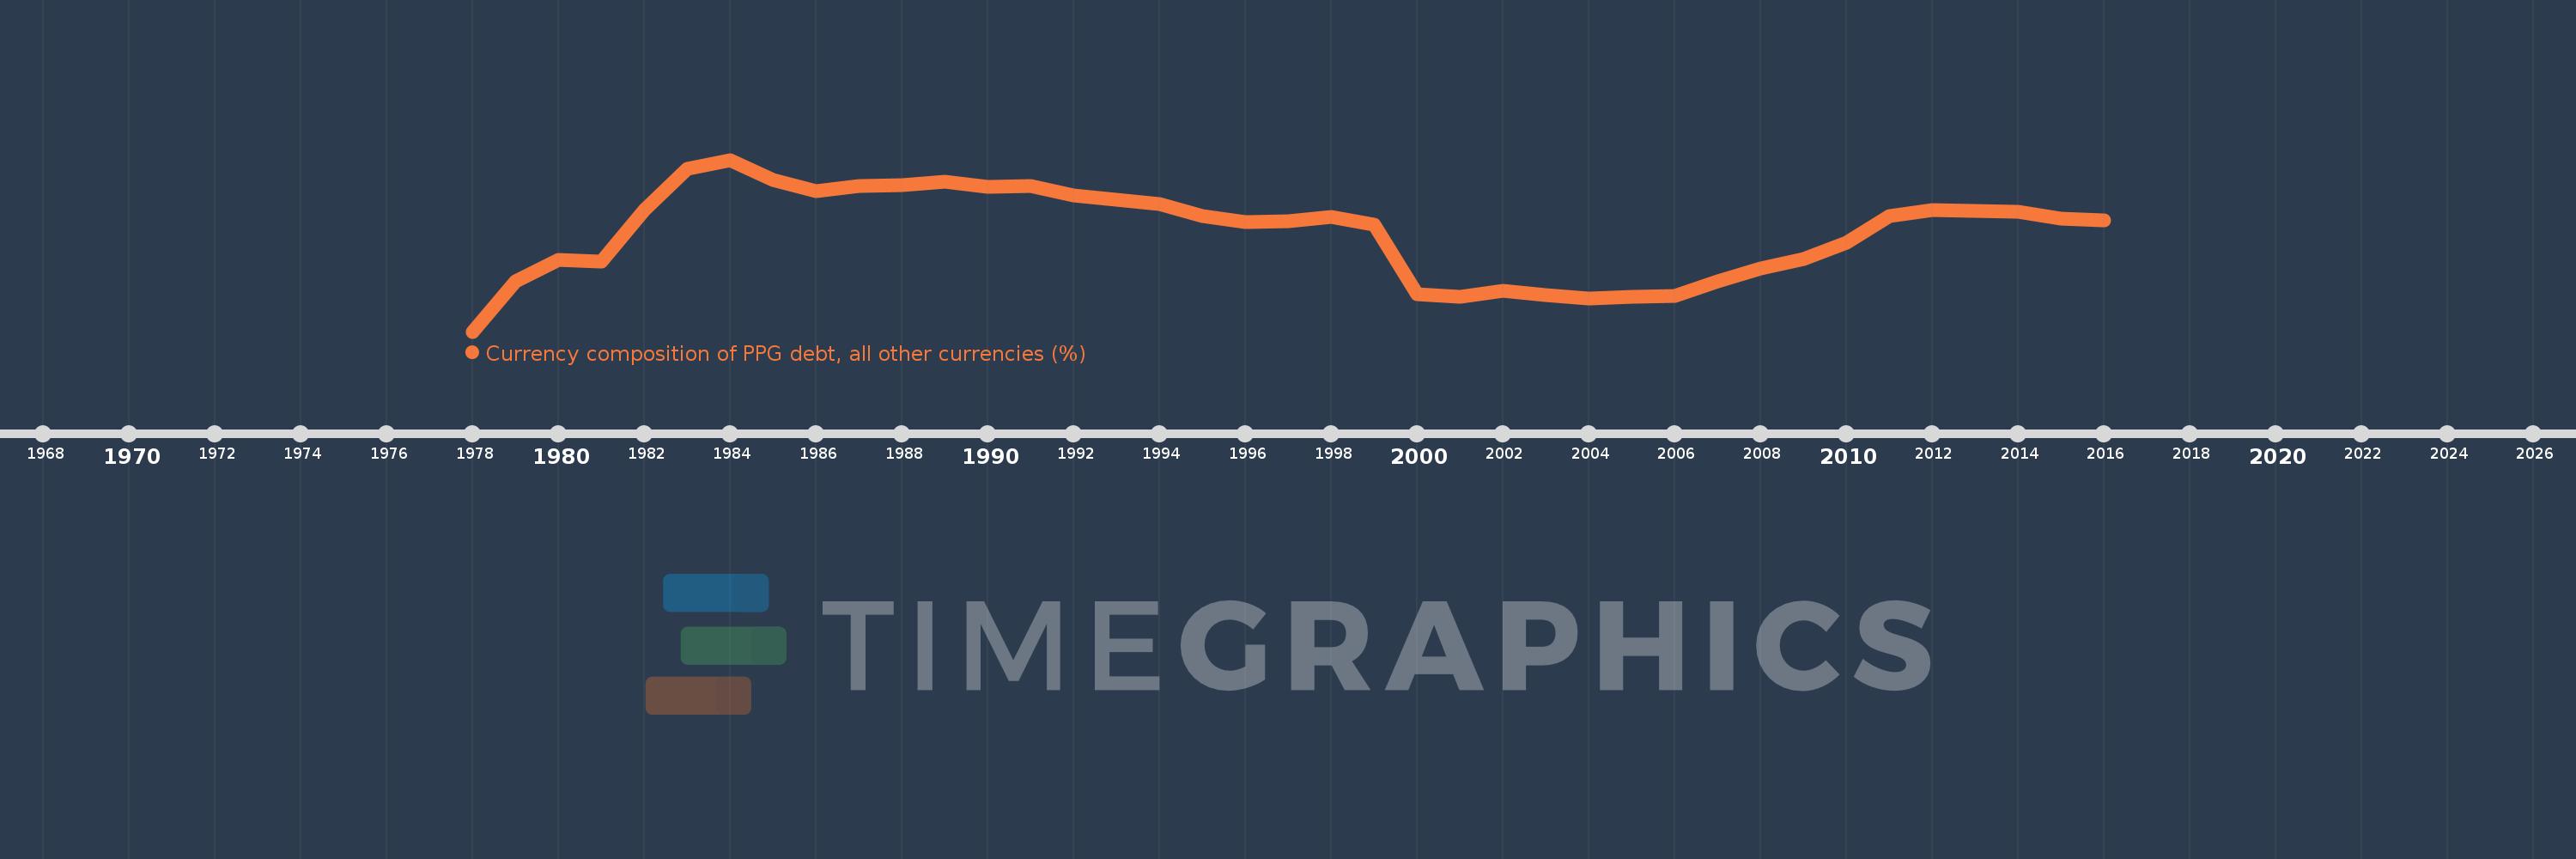
Currency composition of PPG debt, all other currencies (%)
2016,2015,2014,2013,2012,2011,2010,2009,2008,2007,2006,2005,2004,2003,2002,2001,2000,1999,1998,1997,1996,1995,1994,1993,1992,1991,1990,1989,1988,1987,1986,1985,1984,1983,1982,1981,1980,1979,1978
Estas estadísticas en otros países:
línea de tiempo (timeline):
En esta escala de tiempo se presenta un gráfico de 1978 y 2016 de Low income. Los datos de 1977 están ausentes. El número de observaciones reales por fecha: 39.
Fuente (nombre):
Indicadores del desarrollo mundial
Fuente (organización):
World Bank, International Debt Statistics.
Categorías:
External Debt
Se ha actualizado:
23 abr 2017 año
Los indicadores de los cambios de valor en los últimos años
Mínimo:
5.382
1 ene 1978 año
Máximo:
24.43
1 ene 1984 año
A la fecha de observación
Valor
Cambio absoluto
El cambio con respecto al valor anterior
1 ene 1978 año
5.382
+5.382
0.0%
1 ene 1979 año
10.936
+5.553
103.18%
1 ene 1980 año
13.31
+2.374
21.71%
1 ene 1981 año
13.176
-0.134
-1.01%
1 ene 1982 año
18.823
+5.647
42.86%
1 ene 1983 año
23.404
+4.581
24.34%
1 ene 1984 año
24.43
+1.026
4.38%
1 ene 1985 año
22.229
-2.201
-9.01%
1 ene 1986 año
21.001
-1.228
-5.52%
1 ene 1987 año
21.5
+0.499
2.38%
1 ene 1988 año
21.605
+0.105
0.49%
1 ene 1989 año
21.986
+0.381
1.76%
1 ene 1990 año
21.468
-0.517
-2.35%
1 ene 1991 año
21.527
+0.059
0.27%
1 ene 1992 año
20.523
-1.005
-4.67%
1 ene 1993 año
19.975
-0.548
-2.67%
1 ene 1994 año
19.51
-0.465
-2.33%
1 ene 1995 año
18.217
-1.292
-6.62%
1 ene 1996 año
17.509
-0.708
-3.89%
1 ene 1997 año
17.605
+0.096
0.55%
1 ene 1998 año
18.052
+0.446
2.54%
1 ene 1999 año
17.253
-0.799
-4.43%
1 ene 2000 año
9.529
-7.724
-44.77%
1 ene 2001 año
9.216
-0.313
-3.28%
1 ene 2002 año
9.86
+0.644
6.99%
1 ene 2003 año
9.424
-0.436
-4.42%
1 ene 2004 año
9.066
-0.358
-3.8%
1 ene 2005 año
9.197
+0.131
1.45%
1 ene 2006 año
9.382
+0.185
2.01%
1 ene 2007 año
10.988
+1.606
17.11%
1 ene 2008 año
12.417
+1.429
13.01%
1 ene 2009 año
13.454
+1.038
8.36%
1 ene 2010 año
15.219
+1.764
13.11%
1 ene 2011 año
18.176
+2.957
19.43%
1 ene 2012 año
18.838
+0.663
3.65%
1 ene 2013 año
18.737
-0.101
-0.54%
1 ene 2014 año
18.694
-0.044
-0.23%
1 ene 2015 año
17.894
-0.8
-4.28%
1 ene 2016 año
17.736
-0.158
-0.88%
Ranking de los países por los datos estadísticos actuales


Comentarios: