29
/es/
es
AIzaSyAYiBZKx7MnpbEhh9jyipgxe19OcubqV5w
April 1, 2024
45941
Low income
LIC
false
2
1
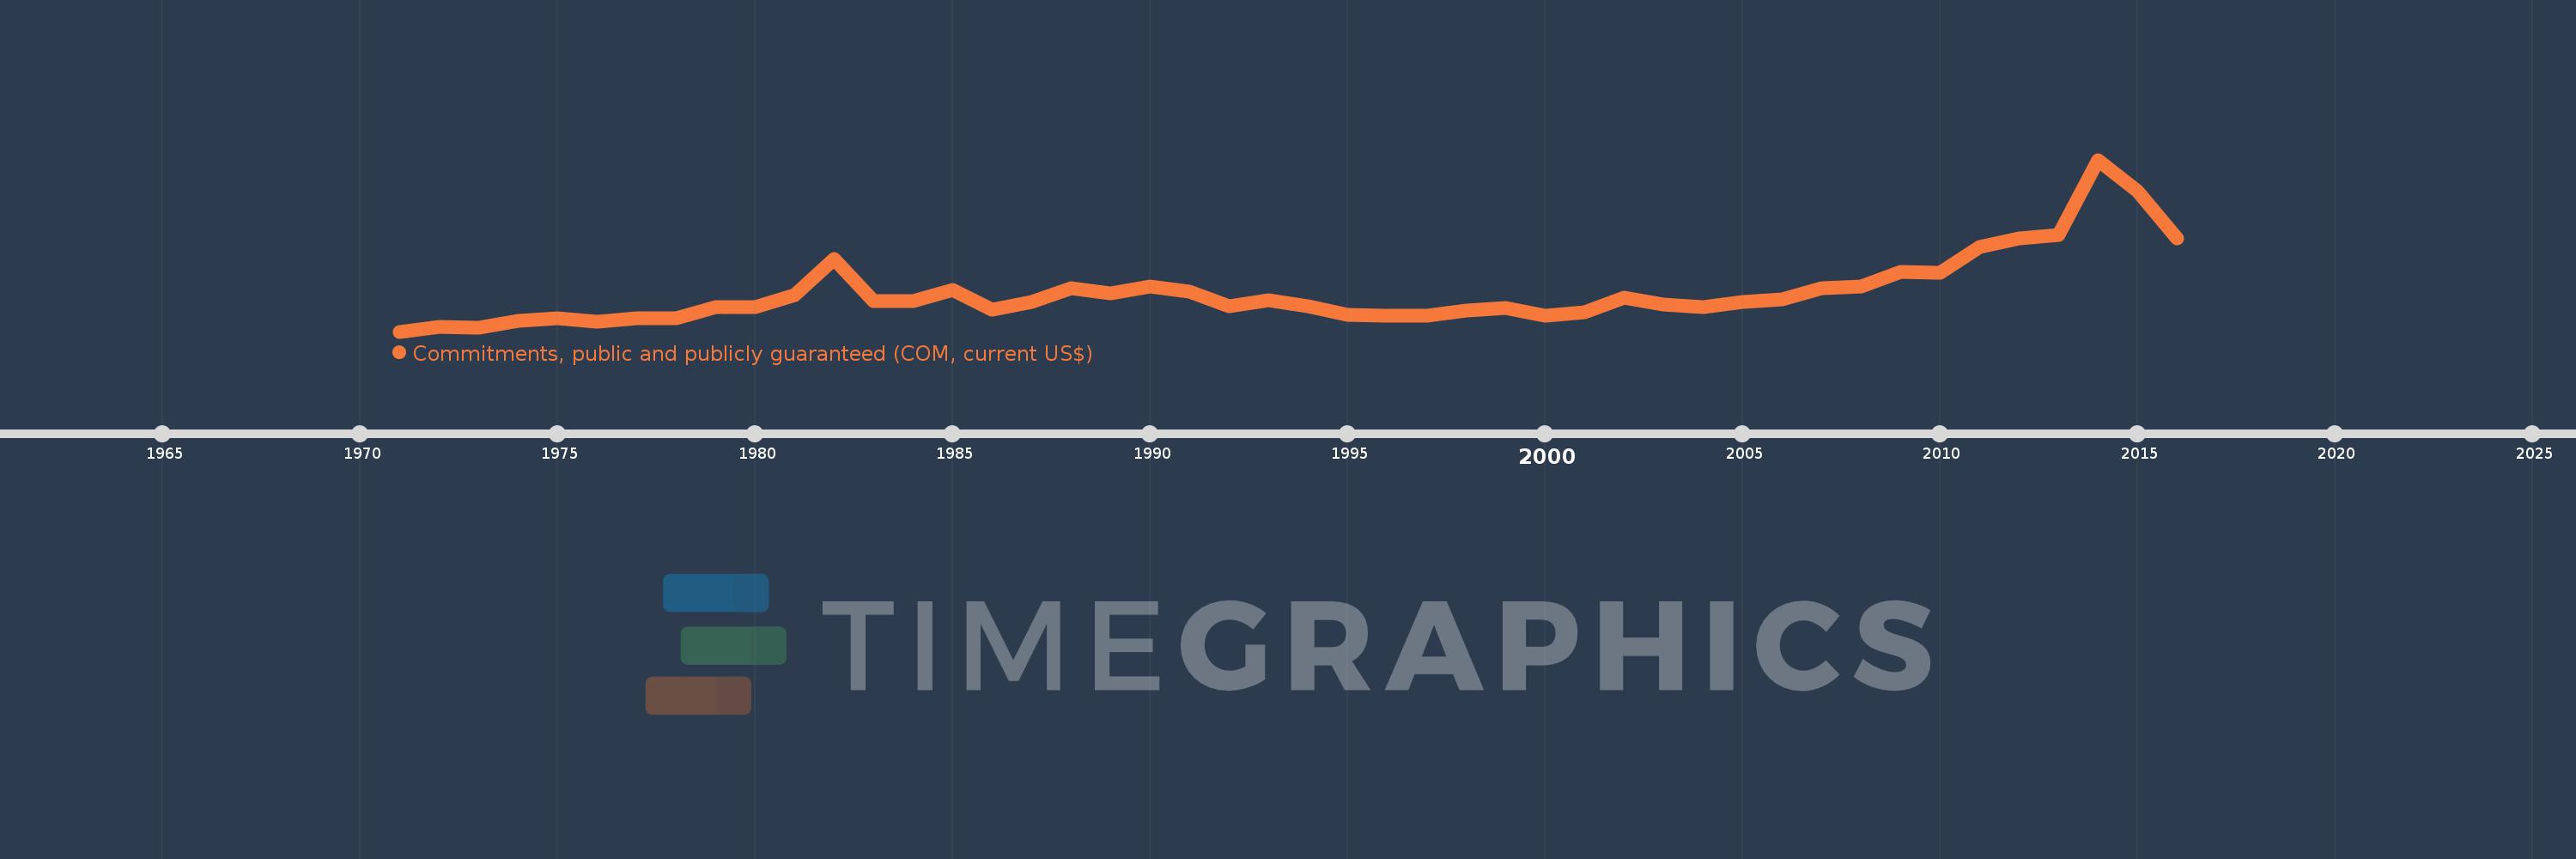
Commitments, public and publicly guaranteed (COM, current US$)
2016,2015,2014,2013,2012,2011,2010,2009,2008,2007,2006,2005,2004,2003,2002,2001,2000,1999,1998,1997,1996,1995,1994,1993,1992,1991,1990,1989,1988,1987,1986,1985,1984,1983,1982,1981,1980,1979,1978,1977,1976,1975,1974,1973,1972,1971
Estas estadísticas en otros países:
línea de tiempo (timeline):
En esta escala de tiempo se presenta un gráfico de 1971 y 2016 de Low income. Los datos de 1970 están ausentes. El número de observaciones reales por fecha: 46.
Fuente (nombre):
Indicadores del desarrollo mundial
Fuente (organización):
World Bank, International Debt Statistics.
Categorías:
External Debt
Se ha actualizado:
23 abr 2017 año
Los indicadores de los cambios de valor en los últimos años
Mínimo:
858.399 millones
1 ene 1971 año
Máximo:
20.539 bn
1 ene 2014 año
A la fecha de observación
Valor
Cambio absoluto
El cambio con respecto al valor anterior
1 ene 1971 año
858.399 millones
+858.399 millones
0.0%
1 ene 1972 año
1.427 bn
+568.896 millones
66.27%
1 ene 1973 año
1.345 bn
-82.744 millones
-5.8%
1 ene 1974 año
2.1 bn
+755.697 millones
56.2%
1 ene 1975 año
2.354 bn
+253.486 millones
12.07%
1 ene 1976 año
1.965 bn
-388.251 millones
-16.5%
1 ene 1977 año
2.335 bn
+369.624 millones
18.81%
1 ene 1978 año
2.412 bn
+76.568 millones
3.28%
1 ene 1979 año
3.702 bn
+1.291 bn
53.52%
1 ene 1980 año
3.647 bn
-55.678 millones
-1.5%
1 ene 1981 año
5.006 bn
+1.359 bn
37.27%
1 ene 1982 año
9.162 bn
+4.156 bn
83.02%
1 ene 1983 año
4.393 bn
-4.769 bn
-52.05%
1 ene 1984 año
4.308 bn
-85.56 millones
-1.95%
1 ene 1985 año
5.595 bn
+1.287 bn
29.88%
1 ene 1986 año
3.328 bn
-2.267 bn
-40.52%
1 ene 1987 año
4.222 bn
+894.276 millones
26.87%
1 ene 1988 año
5.818 bn
+1.596 bn
37.81%
1 ene 1989 año
5.204 bn
-614.057 millones
-10.55%
1 ene 1990 año
6.018 bn
+814.05 millones
15.64%
1 ene 1991 año
5.454 bn
-564.259 millones
-9.38%
1 ene 1992 año
3.807 bn
-1.647 bn
-30.19%
1 ene 1993 año
4.428 bn
+620.19 millones
16.29%
1 ene 1994 año
3.724 bn
-703.831 millones
-15.9%
1 ene 1995 año
2.803 bn
-921.109 millones
-24.74%
1 ene 1996 año
2.698 bn
-104.552 millones
-3.73%
1 ene 1997 año
2.65 bn
-47.918 millones
-1.78%
1 ene 1998 año
3.265 bn
+615.103 millones
23.21%
1 ene 1999 año
3.573 bn
+308.114 millones
9.44%
1 ene 2000 año
2.638 bn
-934.898 millones
-26.16%
1 ene 2001 año
3.106 bn
+467.621 millones
17.72%
1 ene 2002 año
4.717 bn
+1.61 bn
51.85%
1 ene 2003 año
3.935 bn
-781.126 millones
-16.56%
1 ene 2004 año
3.689 bn
-246.668 millones
-6.27%
1 ene 2005 año
4.27 bn
+580.859 millones
15.75%
1 ene 2006 año
4.538 bn
+268.197 millones
6.28%
1 ene 2007 año
5.875 bn
+1.338 bn
29.48%
1 ene 2008 año
6.07 bn
+194.389 millones
3.31%
1 ene 2009 año
7.723 bn
+1.653 bn
27.23%
1 ene 2010 año
7.584 bn
-138.242 millones
-1.79%
1 ene 2011 año
10.568 bn
+2.984 bn
39.34%
1 ene 2012 año
11.488 bn
+920.015 millones
8.71%
1 ene 2013 año
11.97 bn
+482.353 millones
4.2%
1 ene 2014 año
20.539 bn
+8.568 bn
71.58%
1 ene 2015 año
16.963 bn
-3.576 bn
-17.41%
1 ene 2016 año
11.495 bn
-5.468 bn
-32.23%
Ranking de los países por los datos estadísticos actuales


Comentarios: