29
/es/
es
AIzaSyAYiBZKx7MnpbEhh9jyipgxe19OcubqV5w
April 1, 2024
45844
Low income
LIC
false
2
1
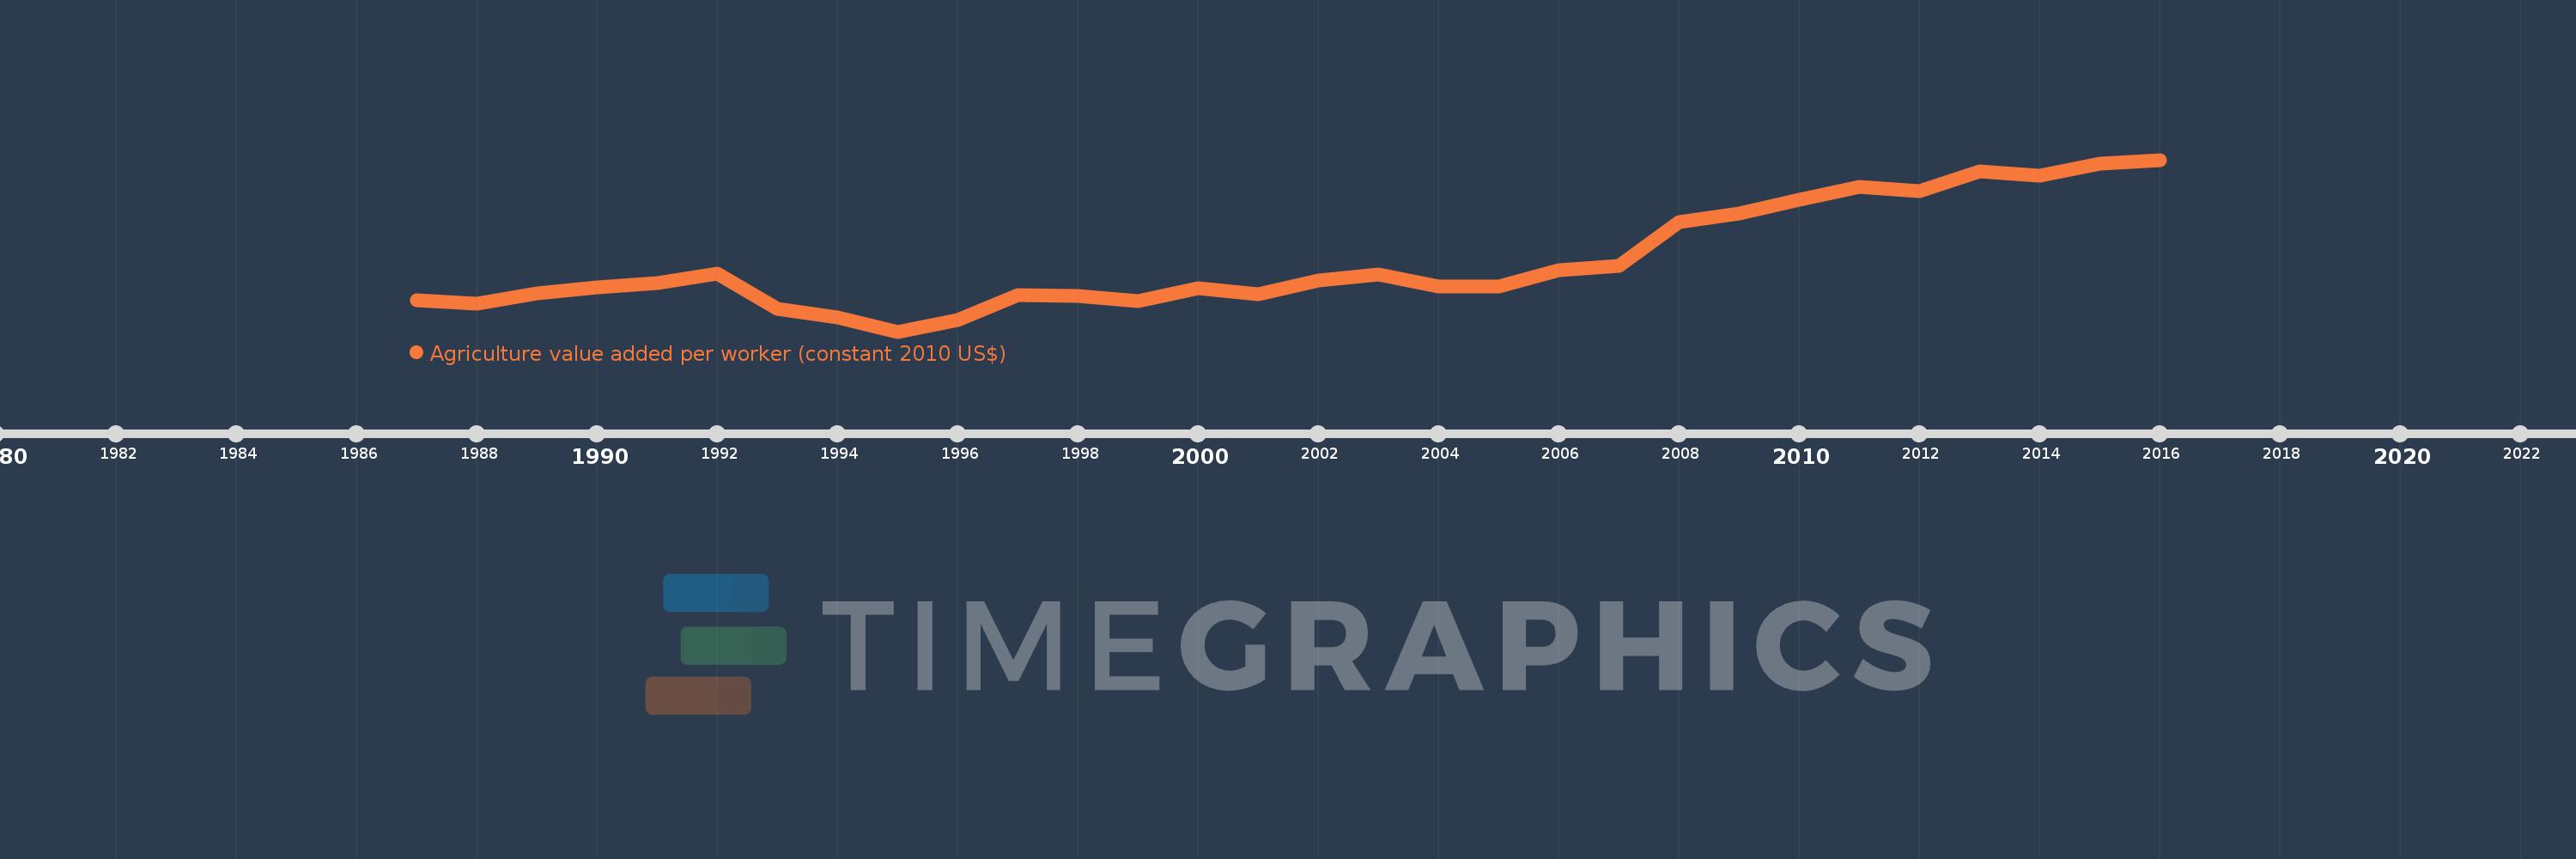
Agriculture value added per worker (constant 2010 US$)
2016,2015,2014,2013,2012,2011,2010,2009,2008,2007,2006,2005,2004,2003,2002,2001,2000,1999,1998,1997,1996,1995,1994,1993,1992,1991,1990,1989,1988,1987
Estas estadísticas en otros países:
AfghanistanAlbaniaAlgeriaAndorraAntigua and BarbudaArab WorldArgentinaArmeniaArubaAustraliaAustriaAzerbaijanBahamas, TheBahrainBangladeshBarbadosBelarusBelgiumBelizeBeninBermudaBhutanBoliviaBosnia and HerzegovinaBotswanaBrazilBrunei DarussalamBulgariaBurkina FasoBurundiCabo VerdeCambodiaCameroonCanadaCaribbean small statesCentral African RepublicCentral Europe and the BalticsChadChileChinaColombiaComorosCongo, Dem. Rep.Congo, Rep.Costa RicaCote d'IvoireCroatiaCubaCyprusCzech RepublicDenmarkDominicaDominican RepublicEarly-demographic dividendEast Asia & PacificEast Asia & Pacific (excluding high income)East Asia & Pacific (IDA & IBRD countries)EcuadorEgypt, Arab Rep.El SalvadorEquatorial GuineaEstoniaEthiopiaEuro areaEurope & Central AsiaEurope & Central Asia (excluding high income)Europe & Central Asia (IDA & IBRD countries)European UnionFijiFinlandFragile and conflict affected situationsFranceGabonGambia, TheGeorgiaGermanyGhanaGreeceGrenadaGuatemalaGuineaGuinea-BissauGuyanaHeavily indebted poor countries (HIPC)High incomeHondurasHungaryIBRD onlyIcelandIDA & IBRD totalIDA blendIDA onlyIDA totalIndiaIndonesiaIran, Islamic Rep.IraqIrelandItalyJamaicaJapanJordanKazakhstanKenyaKiribatiKorea, Rep.KuwaitKyrgyz RepublicLao PDRLate-demographic dividendLatin America & Caribbean Latin America & Caribbean (excluding high income)Latin America & the Caribbean (IDA & IBRD countries)LatviaLeast developed countries: UN classificationLebanonLesothoLiberiaLithuaniaLow & middle incomeLow incomeLower middle incomeLuxembourgMacedonia, FYRMadagascarMalawiMalaysiaMaldivesMaliMaltaMarshall IslandsMauritaniaMauritiusMexicoMicronesia, Fed. Sts.Middle East & North AfricaMiddle East & North Africa (excluding high income)Middle East & North Africa (IDA & IBRD countries)Middle incomeMoldovaMongoliaMontenegroMoroccoMozambiqueMyanmarNamibiaNepalNetherlandsNew ZealandNicaraguaNigerNigeriaNorth AmericaNorwayOECD membersOmanOther small statesPakistanPalauPanamaParaguayPeruPhilippinesPolandPortugalPost-demographic dividendPre-demographic dividendPuerto RicoQatarRomaniaRussian FederationRwandaSamoaSao Tome and PrincipeSaudi ArabiaSenegalSerbiaSeychellesSierra LeoneSingaporeSlovak RepublicSloveniaSmall statesSouth AfricaSouth AsiaSouth Asia (IDA & IBRD)SpainSri LankaSt. Kitts and NevisSt. LuciaSt. Vincent and the GrenadinesSub-Saharan Africa Sub-Saharan Africa (excluding high income)Sub-Saharan Africa (IDA & IBRD countries)SudanSurinameSwazilandSwedenSwitzerlandTajikistanTanzaniaThailandTimor-LesteTogoTongaTrinidad and TobagoTunisiaTurkeyTurkmenistanTuvaluUgandaUkraineUnited Arab EmiratesUnited KingdomUnited StatesUpper middle incomeUruguayUzbekistanVanuatuVenezuela, RBVietnamWest Bank and GazaWorldYemen, Rep.ZambiaZimbabwe línea de tiempo (timeline):
En esta escala de tiempo se presenta un gráfico de 1987 y 2016 de Low income. Los datos de 1986 están ausentes. El número de observaciones reales por fecha: 30.
Fuente (nombre):
Indicadores del desarrollo mundial
Fuente (organización):
Derived from World Bank national accounts files and Food and Agriculture Organization, Production Yearbook and data files.
Categorías:
Agriculture & Rural Development
Se ha actualizado:
23 abr 2017 año
Los indicadores de los cambios de valor en los últimos años
Mínimo:
373.855
1 ene 1995 año
Máximo:
504.427
1 ene 2016 año
A la fecha de observación
Valor
Cambio absoluto
El cambio con respecto al valor anterior
1 ene 1987 año
397.759
+397.759
0.0%
1 ene 1988 año
395.065
-2.694
-0.68%
1 ene 1989 año
403.069
+8.004
2.03%
1 ene 1990 año
407.511
+4.442
1.1%
1 ene 1991 año
410.602
+3.091
0.76%
1 ene 1992 año
417.817
+7.215
1.76%
1 ene 1993 año
391.2
-26.617
-6.37%
1 ene 1994 año
384.323
-6.877
-1.76%
1 ene 1995 año
373.855
-10.468
-2.72%
1 ene 1996 año
382.71
+8.855
2.37%
1 ene 1997 año
401.822
+19.112
4.99%
1 ene 1998 año
401.023
-0.799
-0.2%
1 ene 1999 año
397.195
-3.829
-0.95%
1 ene 2000 año
406.657
+9.462
2.38%
1 ene 2001 año
402.234
-4.423
-1.09%
1 ene 2002 año
412.611
+10.377
2.58%
1 ene 2003 año
417.115
+4.504
1.09%
1 ene 2004 año
408.447
-8.668
-2.08%
1 ene 2005 año
408.039
-0.409
-0.1%
1 ene 2006 año
420.658
+12.619
3.09%
1 ene 2007 año
424.079
+3.421
0.81%
1 ene 2008 año
456.83
+32.752
7.72%
1 ene 2009 año
463.912
+7.082
1.55%
1 ene 2010 año
473.866
+9.954
2.15%
1 ene 2011 año
483.574
+9.708
2.05%
1 ene 2012 año
480.416
-3.158
-0.65%
1 ene 2013 año
495.564
+15.147
3.15%
1 ene 2014 año
492.205
-3.358
-0.68%
1 ene 2015 año
501.296
+9.09
1.85%
1 ene 2016 año
504.427
+3.131
0.62%
Ranking de los países por los datos estadísticos actuales


Comentarios: