29
/es/
es
AIzaSyAYiBZKx7MnpbEhh9jyipgxe19OcubqV5w
April 1, 2024
45595
Low & middle income
LMY
false
2
1
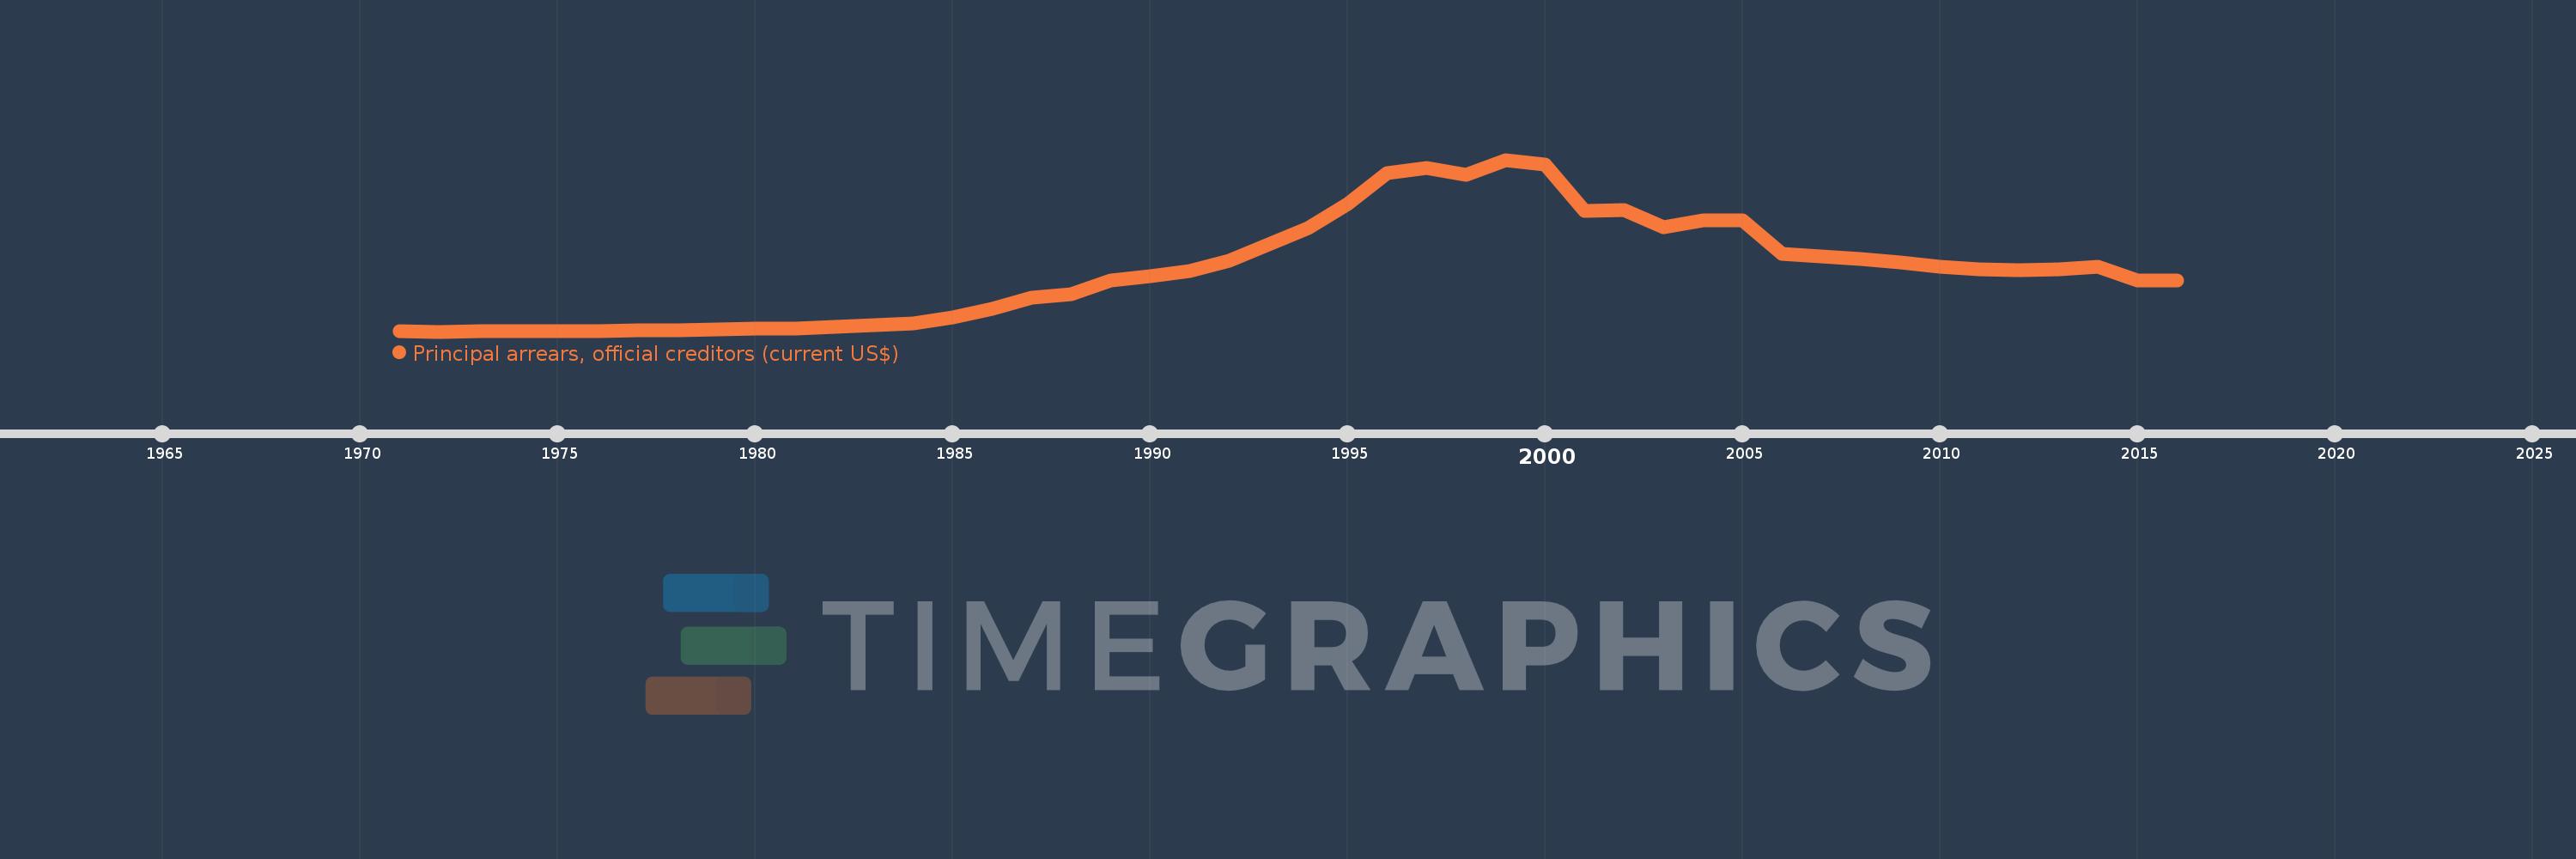
Principal arrears, official creditors (current US$)
2016,2015,2014,2013,2012,2011,2010,2009,2008,2007,2006,2005,2004,2003,2002,2001,2000,1999,1998,1997,1996,1995,1994,1993,1992,1991,1990,1989,1988,1987,1986,1985,1984,1983,1982,1981,1980,1979,1978,1977,1976,1975,1974,1973,1972,1971
Estas estadísticas en otros países:
línea de tiempo (timeline):
En esta escala de tiempo se presenta un gráfico de 1971 y 2016 de Low & middle income. Los datos de 1970 están ausentes. El número de observaciones reales por fecha: 46.
Fuente (nombre):
Indicadores del desarrollo mundial
Fuente (organización):
World Bank, International Debt Statistics.
Categorías:
External Debt
Se ha actualizado:
23 abr 2017 año
Los indicadores de los cambios de valor en los últimos años
Mínimo:
138.501 millones
1 ene 1972 año
Máximo:
63.983 bn
1 ene 1999 año
A la fecha de observación
Valor
Cambio absoluto
El cambio con respecto al valor anterior
1 ene 1971 año
157.574 millones
+157.574 millones
0.0%
1 ene 1972 año
138.501 millones
-19.073 millones
-12.1%
1 ene 1973 año
196.131 millones
+57.63 millones
41.61%
1 ene 1974 año
199.83 millones
+3.699 millones
1.89%
1 ene 1975 año
248.586 millones
+48.756 millones
24.4%
1 ene 1976 año
293.419 millones
+44.833 millones
18.04%
1 ene 1977 año
470.99 millones
+177.571 millones
60.52%
1 ene 1978 año
742.403 millones
+271.413 millones
57.63%
1 ene 1979 año
1.005 bn
+262.257 millones
35.33%
1 ene 1980 año
1.205 bn
+199.951 millones
19.9%
1 ene 1981 año
1.282 bn
+77.248 millones
6.41%
1 ene 1982 año
1.746 bn
+464.066 millones
36.2%
1 ene 1983 año
2.635 bn
+888.718 millones
50.9%
1 ene 1984 año
3.318 bn
+683.428 millones
25.94%
1 ene 1985 año
5.402 bn
+2.084 bn
62.81%
1 ene 1986 año
8.506 bn
+3.104 bn
57.46%
1 ene 1987 año
12.685 bn
+4.179 bn
49.13%
1 ene 1988 año
14.13 bn
+1.445 bn
11.39%
1 ene 1989 año
18.999 bn
+4.869 bn
34.46%
1 ene 1990 año
20.751 bn
+1.752 bn
9.22%
1 ene 1991 año
22.72 bn
+1.968 bn
9.49%
1 ene 1992 año
26.566 bn
+3.847 bn
16.93%
1 ene 1993 año
32.472 bn
+5.906 bn
22.23%
1 ene 1994 año
38.518 bn
+6.046 bn
18.62%
1 ene 1995 año
47.532 bn
+9.013 bn
23.4%
1 ene 1996 año
58.943 bn
+11.411 bn
24.01%
1 ene 1997 año
61.03 bn
+2.087 bn
3.54%
1 ene 1998 año
58.321 bn
-2.709 bn
-4.44%
1 ene 1999 año
63.983 bn
+5.661 bn
9.71%
1 ene 2000 año
62.377 bn
-1.606 bn
-2.51%
1 ene 2001 año
45.07 bn
-17.307 bn
-27.75%
1 ene 2002 año
45.224 bn
+153.936 millones
0.34%
1 ene 2003 año
38.952 bn
-6.272 bn
-13.87%
1 ene 2004 año
41.573 bn
+2.622 bn
6.73%
1 ene 2005 año
41.616 bn
+42.239 millones
0.1%
1 ene 2006 año
29.082 bn
-12.533 bn
-30.12%
1 ene 2007 año
28.016 bn
-1.066 bn
-3.67%
1 ene 2008 año
27.042 bn
-973.516 millones
-3.47%
1 ene 2009 año
25.686 bn
-1.356 bn
-5.01%
1 ene 2010 año
24.316 bn
-1.371 bn
-5.34%
1 ene 2011 año
23.276 bn
-1.039 bn
-4.27%
1 ene 2012 año
22.884 bn
-392.605 millones
-1.69%
1 ene 2013 año
23.437 bn
+553.68 millones
2.42%
1 ene 2014 año
24.123 bn
+686.089 millones
2.93%
1 ene 2015 año
19.031 bn
-5.093 bn
-21.11%
1 ene 2016 año
19.052 bn
+21.168 millones
0.11%
Ranking de los países por los datos estadísticos actuales


Comentarios: