29
/es/
es
AIzaSyAYiBZKx7MnpbEhh9jyipgxe19OcubqV5w
April 1, 2024
45555
Low & middle income
LMY
false
2
1
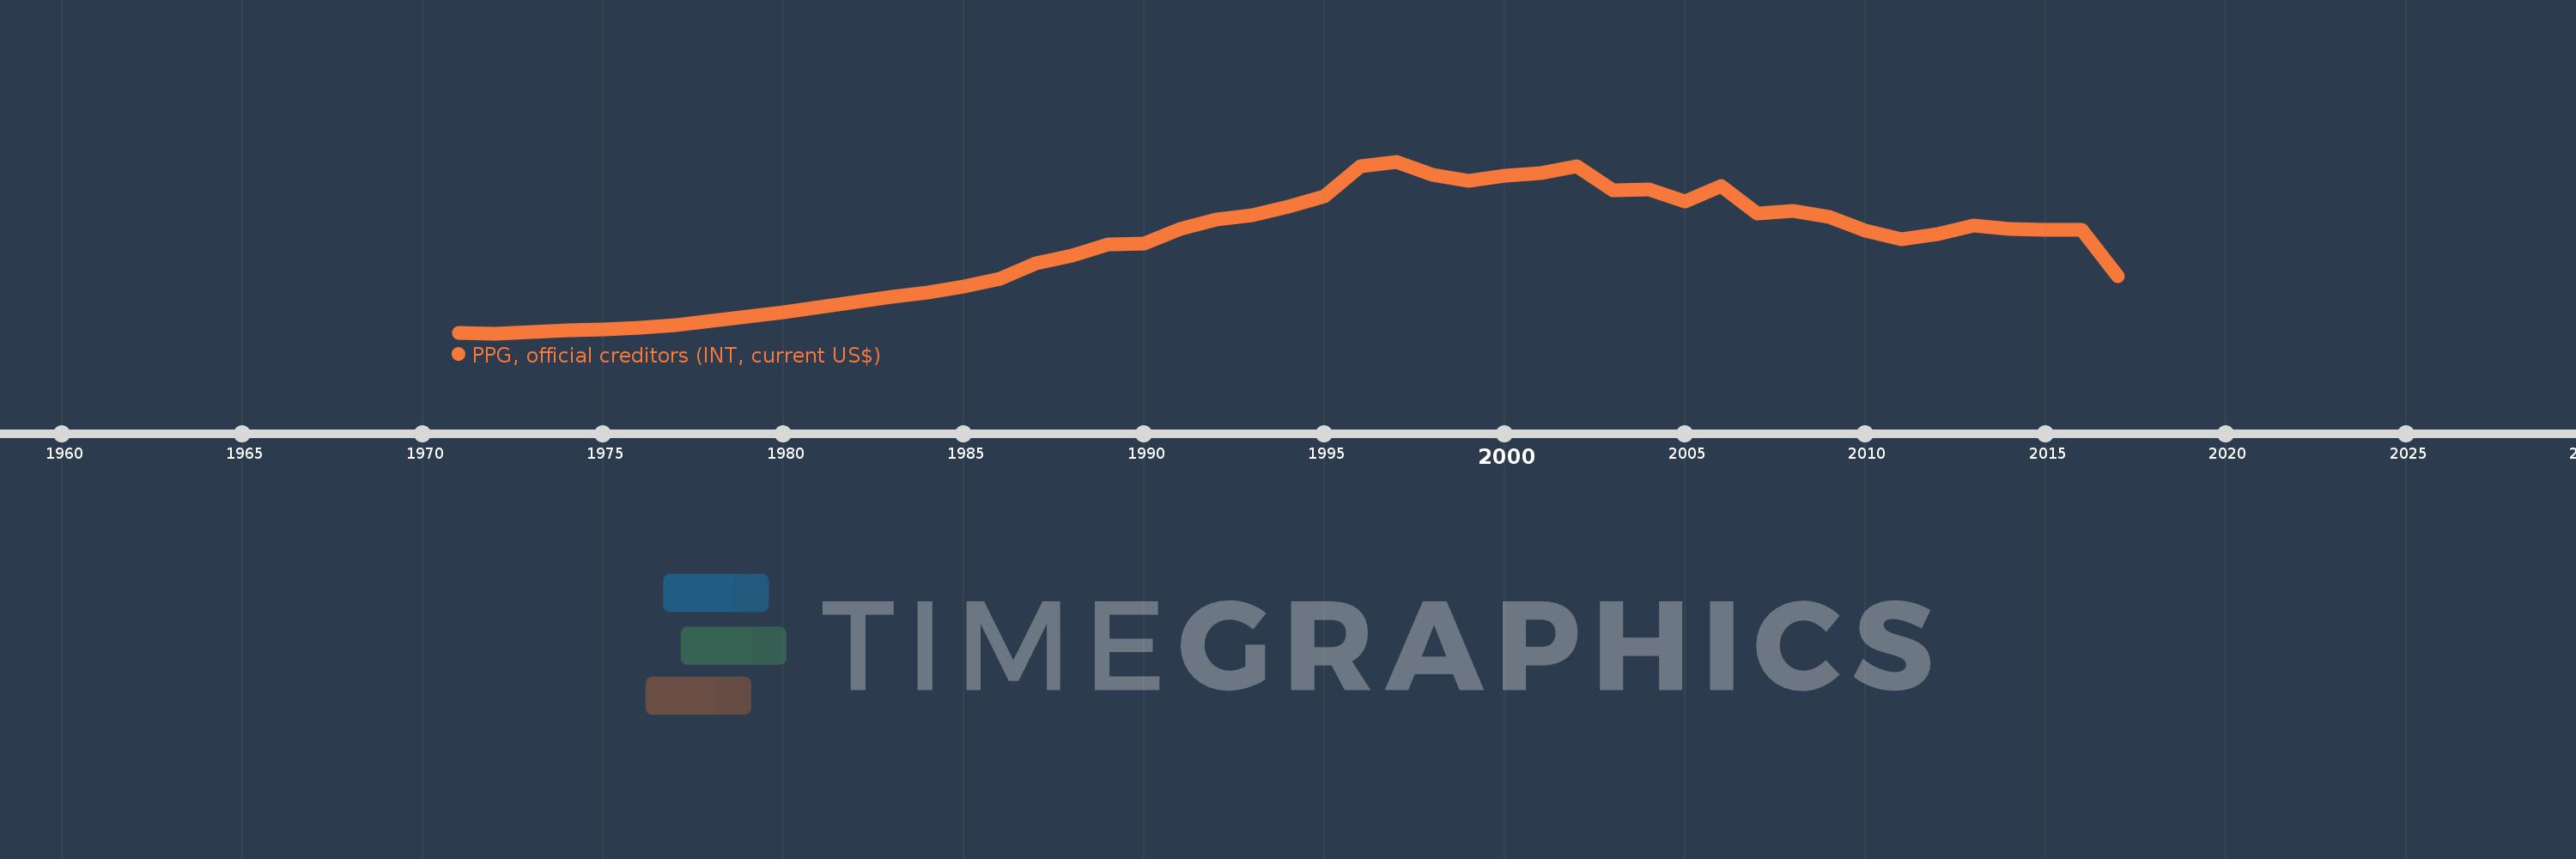
PPG, official creditors (INT, current US$)
2017,2016,2015,2014,2013,2012,2011,2010,2009,2008,2007,2006,2005,2004,2003,2002,2001,2000,1999,1998,1997,1996,1995,1994,1993,1992,1991,1990,1989,1988,1987,1986,1985,1984,1983,1982,1981,1980,1979,1978,1977,1976,1975,1974,1973,1972,1971
Estas estadísticas en otros países:
línea de tiempo (timeline):
En esta escala de tiempo se presenta un gráfico de 1971 y 2017 de Low & middle income. Los datos de 1970 están ausentes. El número de observaciones reales por fecha: 47.
Fuente (nombre):
Indicadores del desarrollo mundial
Fuente (organización):
World Bank, International Debt Statistics.
Categorías:
External Debt
Se ha actualizado:
23 abr 2017 año
Los indicadores de los cambios de valor en los últimos años
Mínimo:
933.662 millones
1 ene 1972 año
Máximo:
27.548 bn
1 ene 1997 año
A la fecha de observación
Valor
Cambio absoluto
El cambio con respecto al valor anterior
1 ene 1971 año
1.029 bn
+1.029 bn
0.0%
1 ene 1972 año
933.662 millones
-95.526 millones
-9.28%
1 ene 1973 año
1.127 bn
+192.979 millones
20.67%
1 ene 1974 año
1.374 bn
+246.905 millones
21.92%
1 ene 1975 año
1.526 bn
+152.613 millones
11.11%
1 ene 1976 año
1.852 bn
+326.016 millones
21.36%
1 ene 1977 año
2.173 bn
+320.526 millones
17.31%
1 ene 1978 año
2.84 bn
+667.082 millones
30.7%
1 ene 1979 año
3.528 bn
+687.74 millones
24.22%
1 ene 1980 año
4.202 bn
+674.21 millones
19.11%
1 ene 1981 año
5.022 bn
+820.587 millones
19.53%
1 ene 1982 año
5.853 bn
+830.337 millones
16.53%
1 ene 1983 año
6.624 bn
+770.856 millones
13.17%
1 ene 1984 año
7.312 bn
+688.55 millones
10.4%
1 ene 1985 año
8.137 bn
+824.646 millones
11.28%
1 ene 1986 año
9.337 bn
+1.201 bn
14.75%
1 ene 1987 año
11.809 bn
+2.472 bn
26.47%
1 ene 1988 año
12.931 bn
+1.122 bn
9.5%
1 ene 1989 año
14.766 bn
+1.835 bn
14.19%
1 ene 1990 año
14.834 bn
+68.123 millones
0.46%
1 ene 1991 año
17.163 bn
+2.329 bn
15.7%
1 ene 1992 año
18.601 bn
+1.438 bn
8.38%
1 ene 1993 año
19.244 bn
+642.969 millones
3.46%
1 ene 1994 año
20.527 bn
+1.284 bn
6.67%
1 ene 1995 año
22.159 bn
+1.631 bn
7.95%
1 ene 1996 año
26.768 bn
+4.61 bn
20.8%
1 ene 1997 año
27.548 bn
+779.406 millones
2.91%
1 ene 1998 año
25.54 bn
-2.008 bn
-7.29%
1 ene 1999 año
24.529 bn
-1.011 bn
-3.96%
1 ene 2000 año
25.287 bn
+757.672 millones
3.09%
1 ene 2001 año
25.718 bn
+431.283 millones
1.71%
1 ene 2002 año
26.817 bn
+1.099 bn
4.27%
1 ene 2003 año
23.065 bn
-3.751 bn
-13.99%
1 ene 2004 año
23.201 bn
+135.24 millones
0.59%
1 ene 2005 año
21.35 bn
-1.851 bn
-7.98%
1 ene 2006 año
23.731 bn
+2.382 bn
11.16%
1 ene 2007 año
19.51 bn
-4.221 bn
-17.79%
1 ene 2008 año
19.879 bn
+369.004 millones
1.89%
1 ene 2009 año
18.993 bn
-886.406 millones
-4.46%
1 ene 2010 año
16.821 bn
-2.172 bn
-11.43%
1 ene 2011 año
15.499 bn
-1.322 bn
-7.86%
1 ene 2012 año
16.268 bn
+768.302 millones
4.96%
1 ene 2013 año
17.621 bn
+1.353 bn
8.32%
1 ene 2014 año
17.042 bn
-578.516 millones
-3.28%
1 ene 2015 año
17.029 bn
-13.306 millones
-0.08%
1 ene 2016 año
16.995 bn
-33.523 millones
-0.2%
1 ene 2017 año
9.848 bn
-7.147 bn
-42.05%
Ranking de los países por los datos estadísticos actuales


Comentarios: