29
/es/
es
AIzaSyAYiBZKx7MnpbEhh9jyipgxe19OcubqV5w
April 1, 2024
45462
Low & middle income
LMY
false
2
1
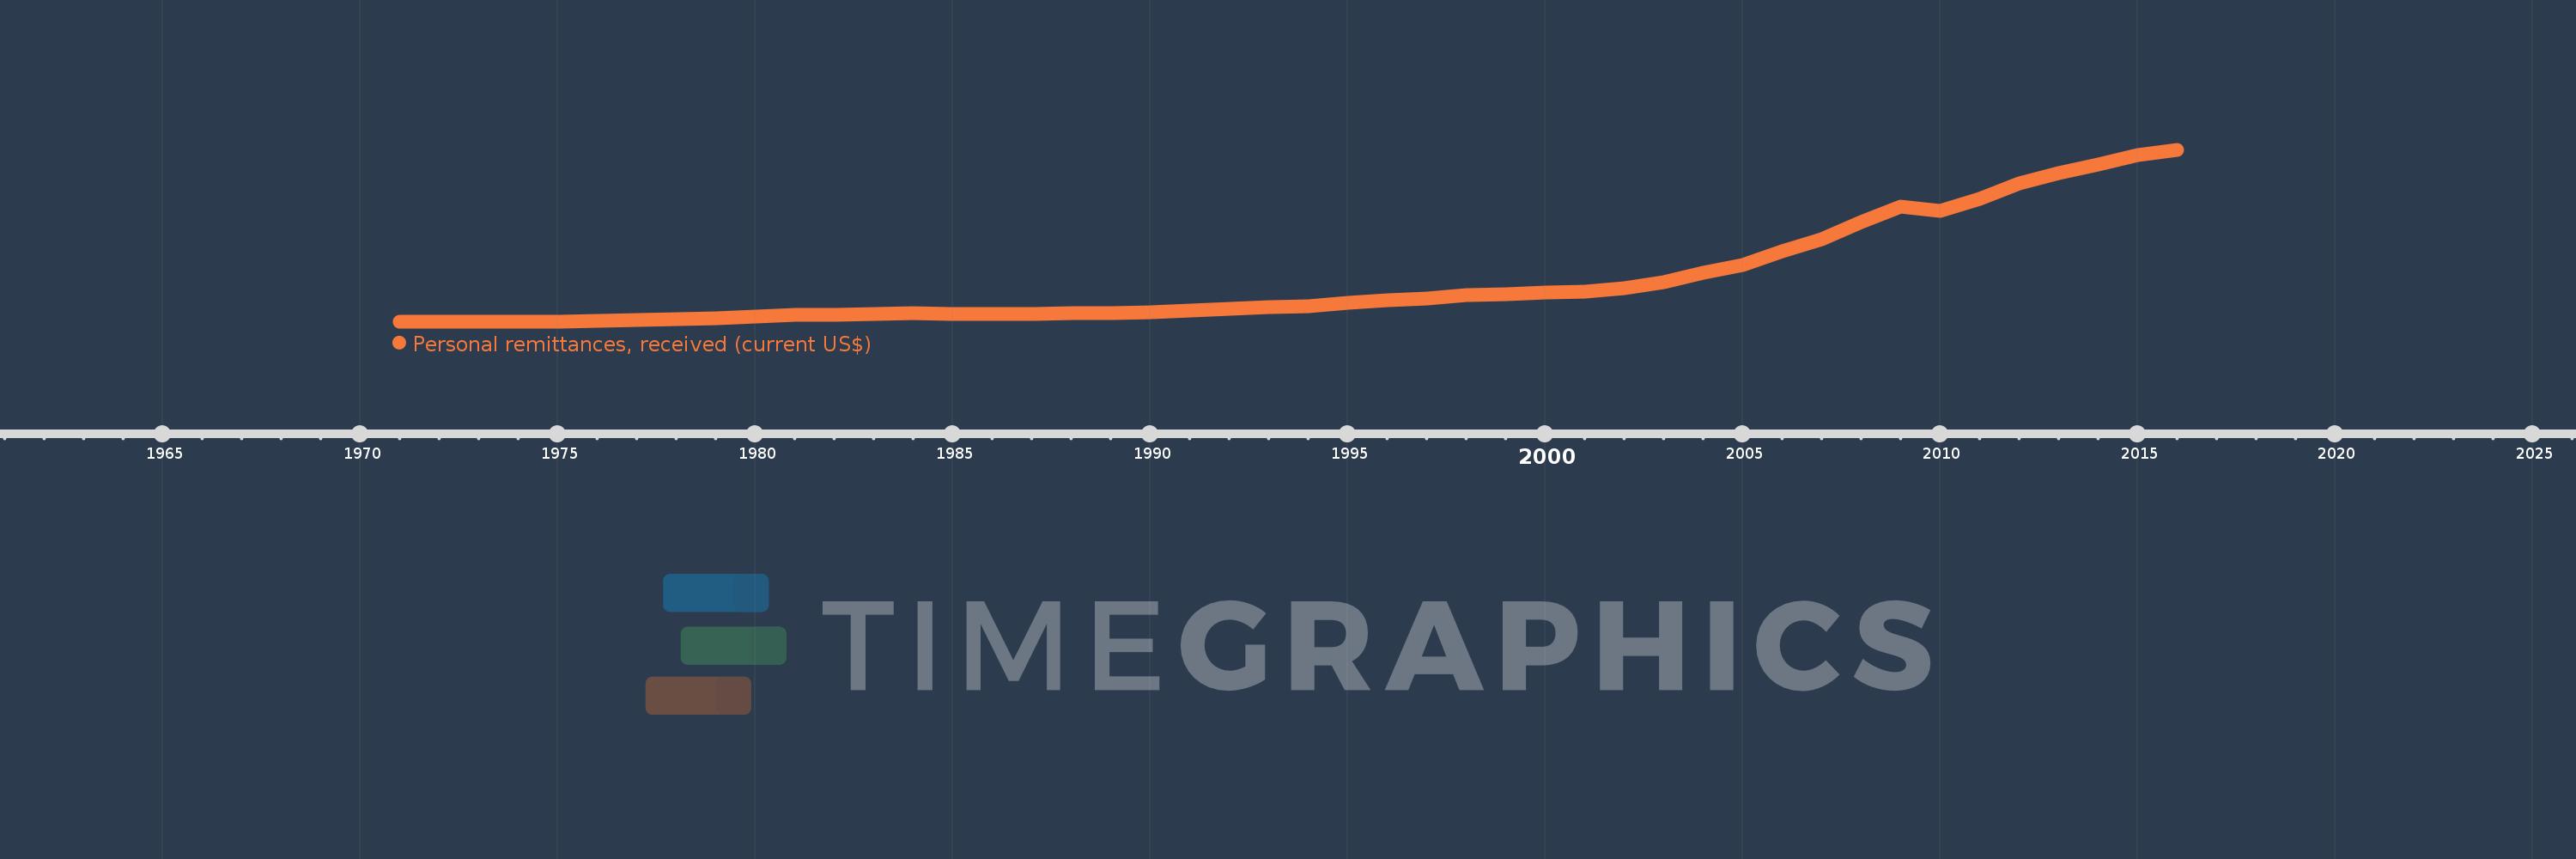
Personal remittances, received (current US$)
2016,2015,2014,2013,2012,2011,2010,2009,2008,2007,2006,2005,2004,2003,2002,2001,2000,1999,1998,1997,1996,1995,1994,1993,1992,1991,1990,1989,1988,1987,1986,1985,1984,1983,1982,1981,1980,1979,1978,1977,1976,1975,1974,1973,1972,1971
Estas estadísticas en otros países:
AfghanistanAlbaniaAlgeriaAngolaAntigua and BarbudaArab WorldArgentinaArmeniaArubaAustraliaAustriaAzerbaijanBangladeshBarbadosBelarusBelgiumBelizeBeninBermudaBhutanBoliviaBosnia and HerzegovinaBotswanaBrazilBulgariaBurkina FasoBurundiCabo VerdeCambodiaCameroonCanadaCaribbean small statesCentral African RepublicCentral Europe and the BalticsChadChileChinaColombiaComorosCongo, Dem. Rep.Congo, Rep.Costa RicaCote d'IvoireCroatiaCuracaoCyprusCzech RepublicDenmarkDjiboutiDominicaDominican RepublicEarly-demographic dividendEast Asia & PacificEast Asia & Pacific (excluding high income)East Asia & Pacific (IDA & IBRD countries)EcuadorEgypt, Arab Rep.El SalvadorEquatorial GuineaEritreaEstoniaEthiopiaEuro areaEurope & Central AsiaEurope & Central Asia (excluding high income)Europe & Central Asia (IDA & IBRD countries)European UnionFaroe IslandsFijiFinlandFragile and conflict affected situationsFranceFrench PolynesiaGabonGambia, TheGeorgiaGermanyGhanaGreeceGrenadaGuatemalaGuineaGuinea-BissauGuyanaHaitiHeavily indebted poor countries (HIPC)High incomeHondurasHong Kong SAR, ChinaHungaryIBRD onlyIcelandIDA & IBRD totalIDA blendIDA onlyIDA totalIndiaIndonesiaIran, Islamic Rep.IraqIrelandIsraelItalyJamaicaJapanJordanKazakhstanKenyaKiribatiKorea, Rep.KosovoKuwaitKyrgyz RepublicLao PDRLate-demographic dividendLatin America & Caribbean Latin America & Caribbean (excluding high income)Latin America & the Caribbean (IDA & IBRD countries)LatviaLeast developed countries: UN classificationLebanonLesothoLiberiaLibyaLithuaniaLow & middle incomeLow incomeLower middle incomeLuxembourgMacao SAR, ChinaMacedonia, FYRMadagascarMalawiMalaysiaMaldivesMaliMaltaMarshall IslandsMauritaniaMauritiusMexicoMicronesia, Fed. Sts.Middle East & North AfricaMiddle East & North Africa (excluding high income)Middle East & North Africa (IDA & IBRD countries)Middle incomeMoldovaMongoliaMontenegroMoroccoMozambiqueMyanmarNamibiaNepalNetherlandsNew CaledoniaNew ZealandNicaraguaNigerNigeriaNorth AmericaNorwayOECD membersOmanOther small statesPacific island small statesPakistanPalauPanamaPapua New GuineaParaguayPeruPhilippinesPolandPortugalPost-demographic dividendPre-demographic dividendQatarRomaniaRussian FederationRwandaSamoaSao Tome and PrincipeSaudi ArabiaSenegalSerbiaSeychellesSierra LeoneSint Maarten (Dutch part)Slovak RepublicSloveniaSmall statesSolomon IslandsSomaliaSouth AfricaSouth AsiaSouth Asia (IDA & IBRD)South SudanSpainSri LankaSt. Kitts and NevisSt. LuciaSt. Vincent and the GrenadinesSub-Saharan Africa Sub-Saharan Africa (excluding high income)Sub-Saharan Africa (IDA & IBRD countries)SudanSurinameSwazilandSwedenSwitzerlandSyrian Arab RepublicTajikistanTanzaniaThailandTimor-LesteTogoTongaTrinidad and TobagoTunisiaTurkeyTurkmenistanTuvaluUgandaUkraineUnited KingdomUnited StatesUpper middle incomeUruguayUzbekistanVanuatuVenezuela, RBVietnamWest Bank and GazaWorldYemen, Rep.ZambiaZimbabwe línea de tiempo (timeline):
En esta escala de tiempo se presenta un gráfico de 1971 y 2016 de Low & middle income. Los datos de 1970 están ausentes. El número de observaciones reales por fecha: 46.
Fuente (nombre):
Indicadores del desarrollo mundial
Fuente (organización):
World Bank staff estimates based on IMF balance of payments data.
Categorías:
Economy & Growth, Financial Sector, External Debt
Se ha actualizado:
23 abr 2017 año
Los indicadores de los cambios de valor en los últimos años
Mínimo:
284.76 millones
1 ene 1971 año
Máximo:
421.333 bn
1 ene 2016 año
A la fecha de observación
Valor
Cambio absoluto
El cambio con respecto al valor anterior
1 ene 1971 año
284.76 millones
+284.76 millones
0.0%
1 ene 1972 año
315.898 millones
+31.138 millones
10.93%
1 ene 1973 año
348.44 millones
+32.542 millones
10.3%
1 ene 1974 año
376.563 millones
+28.123 millones
8.07%
1 ene 1975 año
1.902 bn
+1.525 bn
405.03%
1 ene 1976 año
3.306 bn
+1.405 bn
73.86%
1 ene 1977 año
4.322 bn
+1.016 bn
30.71%
1 ene 1978 año
7.121 bn
+2.799 bn
64.76%
1 ene 1979 año
9.977 bn
+2.856 bn
40.11%
1 ene 1980 año
12.996 bn
+3.019 bn
30.26%
1 ene 1981 año
17.764 bn
+4.768 bn
36.69%
1 ene 1982 año
18.003 bn
+239.491 millones
1.35%
1 ene 1983 año
19.445 bn
+1.441 bn
8.01%
1 ene 1984 año
20.999 bn
+1.554 bn
7.99%
1 ene 1985 año
20.291 bn
-707.738 millones
-3.37%
1 ene 1986 año
19.521 bn
-770.436 millones
-3.8%
1 ene 1987 año
19.875 bn
+354.048 millones
1.81%
1 ene 1988 año
22.775 bn
+2.901 bn
14.59%
1 ene 1989 año
22.774 bn
-1.423 millones
-0.01%
1 ene 1990 año
24.721 bn
+1.947 bn
8.55%
1 ene 1991 año
28.949 bn
+4.229 bn
17.11%
1 ene 1992 año
31.871 bn
+2.922 bn
10.09%
1 ene 1993 año
37.353 bn
+5.482 bn
17.2%
1 ene 1994 año
39.279 bn
+1.925 bn
5.15%
1 ene 1995 año
48.158 bn
+8.879 bn
22.61%
1 ene 1996 año
53.939 bn
+5.781 bn
12.0%
1 ene 1997 año
57.587 bn
+3.648 bn
6.76%
1 ene 1998 año
67.22 bn
+9.633 bn
16.73%
1 ene 1999 año
67.818 bn
+597.895 millones
0.89%
1 ene 2000 año
71.649 bn
+3.831 bn
5.65%
1 ene 2001 año
73.86 bn
+2.211 bn
3.09%
1 ene 2002 año
82.12 bn
+8.26 bn
11.18%
1 ene 2003 año
97.32 bn
+15.2 bn
18.51%
1 ene 2004 año
121.769 bn
+24.449 bn
25.12%
1 ene 2005 año
139.252 bn
+17.483 bn
14.36%
1 ene 2006 año
172.694 bn
+33.442 bn
24.02%
1 ene 2007 año
203.559 bn
+30.865 bn
17.87%
1 ene 2008 año
245.363 bn
+41.804 bn
20.54%
1 ene 2009 año
283.82 bn
+38.457 bn
15.67%
1 ene 2010 año
273.102 bn
-10.717 bn
-3.78%
1 ene 2011 año
301.322 bn
+28.22 bn
10.33%
1 ene 2012 año
338.967 bn
+37.645 bn
12.49%
1 ene 2013 año
365.488 bn
+26.521 bn
7.82%
1 ene 2014 año
385.725 bn
+20.237 bn
5.54%
1 ene 2015 año
409.809 bn
+24.084 bn
6.24%
1 ene 2016 año
421.333 bn
+11.523 bn
2.81%
Ranking de los países por los datos estadísticos actuales


Comentarios: