29
/es/
es
AIzaSyAYiBZKx7MnpbEhh9jyipgxe19OcubqV5w
April 1, 2024
44834
Low & middle income
LMY
false
2
1
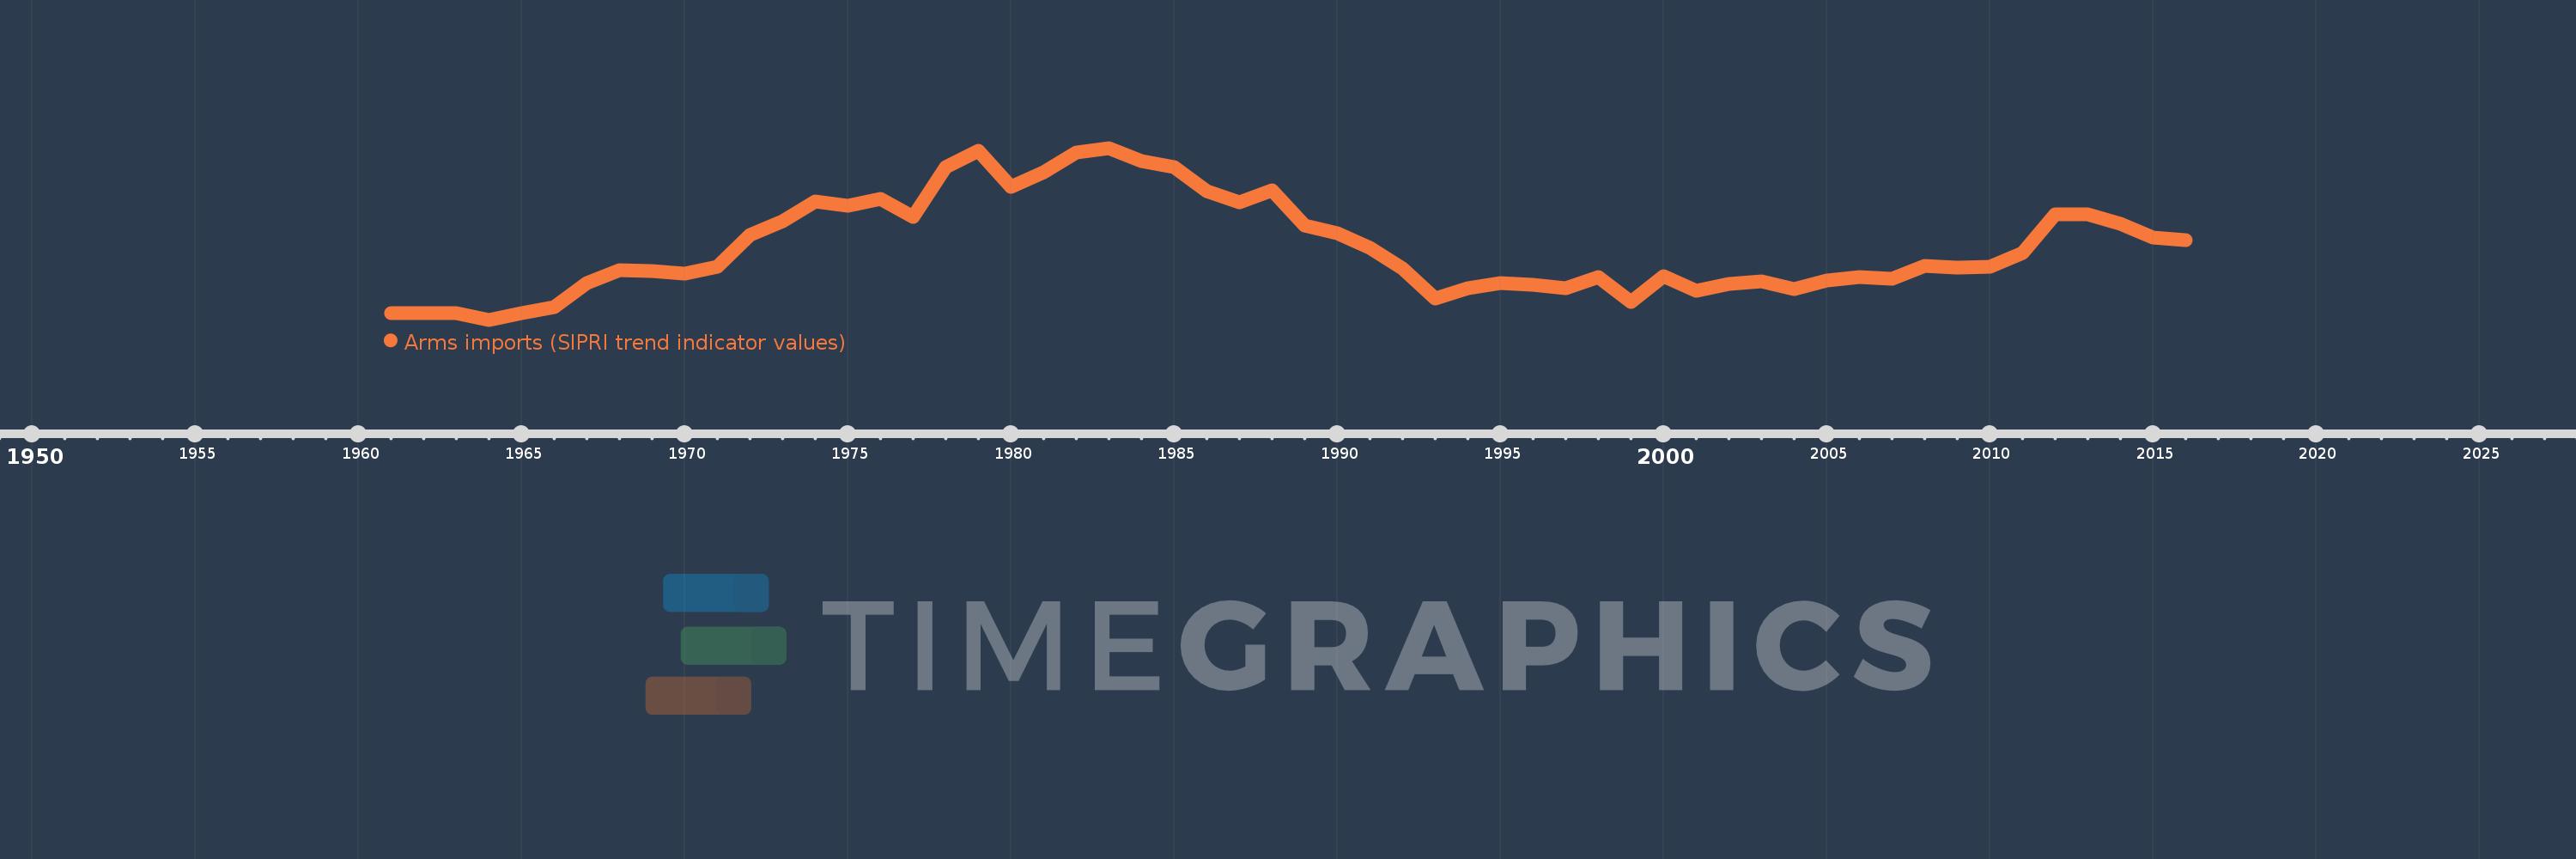
Arms imports (SIPRI trend indicator values)
2016,2015,2014,2013,2012,2011,2010,2009,2008,2007,2006,2005,2004,2003,2002,2001,2000,1999,1998,1997,1996,1995,1994,1993,1992,1991,1990,1989,1988,1987,1986,1985,1984,1983,1982,1981,1980,1979,1978,1977,1976,1975,1974,1973,1972,1971,1970,1969,1968,1967,1966,1965,1964,1963,1961
Estas estadísticas en otros países:
AfghanistanAlbaniaAlgeriaAngolaArab WorldArgentinaArmeniaAustraliaAustriaAzerbaijanBahamas, TheBahrainBangladeshBarbadosBelarusBelgiumBelizeBeninBhutanBoliviaBosnia and HerzegovinaBotswanaBrazilBrunei DarussalamBulgariaBurkina FasoBurundiCabo VerdeCambodiaCameroonCanadaCaribbean small statesCentral African RepublicCentral Europe and the BalticsChadChileChinaColombiaComorosCongo, Dem. Rep.Congo, Rep.Costa RicaCote d'IvoireCroatiaCubaCyprusCzech RepublicDenmarkDjiboutiDominican RepublicEarly-demographic dividendEast Asia & PacificEast Asia & Pacific (excluding high income)East Asia & Pacific (IDA & IBRD countries)EcuadorEgypt, Arab Rep.El SalvadorEquatorial GuineaEritreaEstoniaEthiopiaEuro areaEurope & Central AsiaEurope & Central Asia (excluding high income)Europe & Central Asia (IDA & IBRD countries)European UnionFijiFinlandFragile and conflict affected situationsFranceGabonGambia, TheGeorgiaGermanyGhanaGreeceGrenadaGuatemalaGuineaGuinea-BissauGuyanaHaitiHeavily indebted poor countries (HIPC)High incomeHondurasHungaryIBRD onlyIcelandIDA & IBRD totalIDA blendIDA onlyIDA totalIndiaIndonesiaIran, Islamic Rep.IraqIrelandIsraelItalyJamaicaJapanJordanKazakhstanKenyaKiribatiKorea, Dem. People’s Rep.Korea, Rep.KosovoKuwaitKyrgyz RepublicLao PDRLate-demographic dividendLatin America & Caribbean Latin America & Caribbean (excluding high income)Latin America & the Caribbean (IDA & IBRD countries)LatviaLeast developed countries: UN classificationLebanonLesothoLiberiaLibyaLithuaniaLow & middle incomeLow incomeLower middle incomeLuxembourgMacedonia, FYRMadagascarMalawiMalaysiaMaldivesMaliMaltaMarshall IslandsMauritaniaMauritiusMexicoMicronesia, Fed. Sts.Middle East & North AfricaMiddle East & North Africa (excluding high income)Middle East & North Africa (IDA & IBRD countries)Middle incomeMoldovaMongoliaMoroccoMozambiqueMyanmarNamibiaNepalNetherlandsNew ZealandNicaraguaNigerNigeriaNorth AmericaNorwayOECD membersOmanOther small statesPacific island small statesPakistanPalauPanamaPapua New GuineaParaguayPeruPhilippinesPolandPortugalPost-demographic dividendPre-demographic dividendQatarRomaniaRussian FederationRwandaSamoaSaudi ArabiaSenegalSerbiaSeychellesSierra LeoneSingaporeSlovak RepublicSloveniaSmall statesSolomon IslandsSomaliaSouth AfricaSouth AsiaSouth Asia (IDA & IBRD)South SudanSpainSri LankaSt. Kitts and NevisSt. Vincent and the GrenadinesSub-Saharan Africa Sub-Saharan Africa (excluding high income)Sub-Saharan Africa (IDA & IBRD countries)SudanSurinameSwazilandSwedenSwitzerlandSyrian Arab RepublicTajikistanTanzaniaThailandTimor-LesteTogoTongaTrinidad and TobagoTunisiaTurkeyTurkmenistanTuvaluUgandaUkraineUnited Arab EmiratesUnited KingdomUnited StatesUpper middle incomeUruguayUzbekistanVanuatuVenezuela, RBVietnamWest Bank and GazaWorldYemen, Rep.ZambiaZimbabwe línea de tiempo (timeline):
En esta escala de tiempo se presenta un gráfico de 1961 y 2016 de Low & middle income. Los datos de 1960 están ausentes. El número de observaciones reales por fecha: 55.
Fuente (nombre):
Indicadores del desarrollo mundial
Fuente (organización):
Stockholm International Peace Research Institute (SIPRI), Arms Transfers Programme (http://portal.sipri.org/publications/pages/transfer/splash).
Categorías:
Public Sector, Trade
Se ha actualizado:
23 abr 2017 año
Los indicadores de los cambios de valor en los últimos años
Mínimo:
6.124 bn
1 ene 1964 año
Máximo:
25.874 bn
1 ene 1983 año
A la fecha de observación
Valor
Cambio absoluto
El cambio con respecto al valor anterior
1 ene 1961 año
6.915 bn
+6.915 bn
0.0%
1 ene 1963 año
6.864 bn
-51.0 millones
-0.74%
1 ene 1964 año
6.124 bn
-740.0 millones
-10.78%
1 ene 1965 año
6.874 bn
+750.0 millones
12.25%
1 ene 1966 año
7.597 bn
+723.0 millones
10.52%
1 ene 1967 año
10.353 bn
+2.756 bn
36.28%
1 ene 1968 año
11.812 bn
+1.459 bn
14.09%
1 ene 1969 año
11.735 bn
-77.0 millones
-0.65%
1 ene 1970 año
11.458 bn
-277.0 millones
-2.36%
1 ene 1971 año
12.183 bn
+725.0 millones
6.33%
1 ene 1972 año
15.848 bn
+3.665 bn
30.08%
1 ene 1973 año
17.411 bn
+1.563 bn
9.86%
1 ene 1974 año
19.695 bn
+2.284 bn
13.12%
1 ene 1975 año
19.273 bn
-422.0 millones
-2.14%
1 ene 1976 año
19.973 bn
+700.0 millones
3.63%
1 ene 1977 año
17.953 bn
-2.02 bn
-10.11%
1 ene 1978 año
23.693 bn
+5.74 bn
31.97%
1 ene 1979 año
25.549 bn
+1.856 bn
7.83%
1 ene 1980 año
21.361 bn
-4.188 bn
-16.39%
1 ene 1981 año
23.067 bn
+1.706 bn
7.99%
1 ene 1982 año
25.379 bn
+2.312 bn
10.02%
1 ene 1983 año
25.874 bn
+495.0 millones
1.95%
1 ene 1984 año
24.351 bn
-1.523 bn
-5.89%
1 ene 1985 año
23.634 bn
-717.0 millones
-2.94%
1 ene 1986 año
20.907 bn
-2.727 bn
-11.54%
1 ene 1987 año
19.629 bn
-1.278 bn
-6.11%
1 ene 1988 año
21.016 bn
+1.387 bn
7.07%
1 ene 1989 año
16.98 bn
-4.036 bn
-19.2%
1 ene 1990 año
16.081 bn
-899.0 millones
-5.29%
1 ene 1991 año
14.341 bn
-1.74 bn
-10.82%
1 ene 1992 año
11.993 bn
-2.348 bn
-16.37%
1 ene 1993 año
8.535 bn
-3.458 bn
-28.83%
1 ene 1994 año
9.74 bn
+1.205 bn
14.12%
1 ene 1995 año
10.309 bn
+569.0 millones
5.84%
1 ene 1996 año
10.106 bn
-203.0 millones
-1.97%
1 ene 1997 año
9.785 bn
-321.0 millones
-3.18%
1 ene 1998 año
11.017 bn
+1.232 bn
12.59%
1 ene 1999 año
8.21 bn
-2.807 bn
-25.48%
1 ene 2000 año
11.136 bn
+2.926 bn
35.64%
1 ene 2001 año
9.46 bn
-1.676 bn
-15.05%
1 ene 2002 año
10.238 bn
+778.0 millones
8.22%
1 ene 2003 año
10.49 bn
+252.0 millones
2.46%
1 ene 2004 año
9.627 bn
-863.0 millones
-8.23%
1 ene 2005 año
10.645 bn
+1.018 bn
10.57%
1 ene 2006 año
11.018 bn
+373.0 millones
3.5%
1 ene 2007 año
10.851 bn
-167.0 millones
-1.52%
1 ene 2008 año
12.291 bn
+1.44 bn
13.27%
1 ene 2009 año
12.153 bn
-138.0 millones
-1.12%
1 ene 2010 año
12.25 bn
+97.0 millones
0.8%
1 ene 2011 año
13.844 bn
+1.594 bn
13.01%
1 ene 2012 año
18.26 bn
+4.416 bn
31.9%
1 ene 2013 año
18.286 bn
+26.0 millones
0.14%
1 ene 2014 año
17.153 bn
-1.133 bn
-6.2%
1 ene 2015 año
15.607 bn
-1.546 bn
-9.01%
1 ene 2016 año
15.284 bn
-323.0 millones
-2.07%
Ranking de los países por los datos estadísticos actuales


Comentarios: