29
/es/
es
AIzaSyAYiBZKx7MnpbEhh9jyipgxe19OcubqV5w
April 1, 2024
44816
Low & middle income
LMY
false
2
1
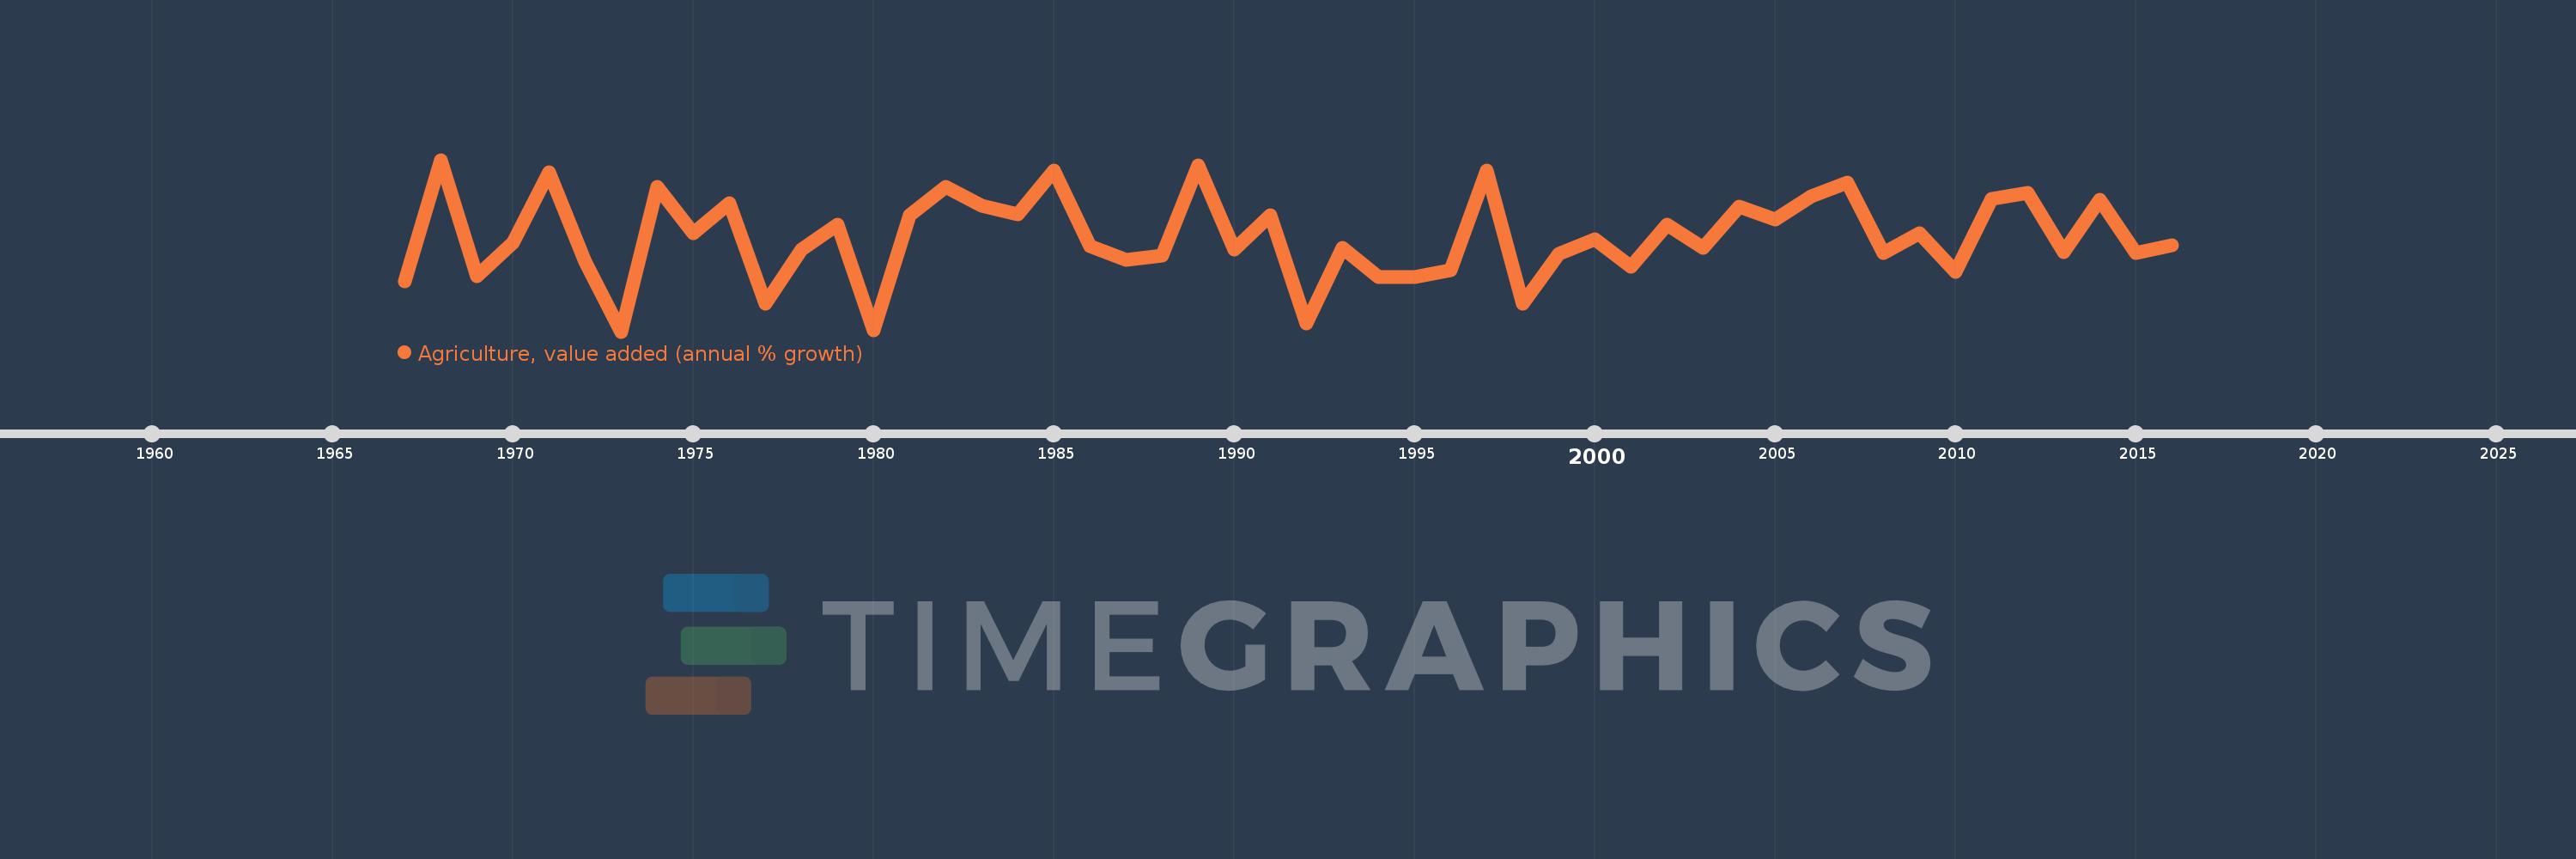
Agriculture, value added (annual % growth)
2016,2015,2014,2013,2012,2011,2010,2009,2008,2007,2006,2005,2004,2003,2002,2001,2000,1999,1998,1997,1996,1995,1994,1993,1992,1991,1990,1989,1988,1987,1986,1985,1984,1983,1982,1981,1980,1979,1978,1977,1976,1975,1974,1973,1972,1971,1970,1969,1968,1967
Estas estadísticas en otros países:
AfghanistanAlbaniaAlgeriaAntigua and BarbudaArab WorldArgentinaArmeniaAustraliaAustriaAzerbaijanBahamas, TheBahrainBangladeshBelarusBelgiumBelizeBeninBermudaBhutanBoliviaBosnia and HerzegovinaBotswanaBrazilBrunei DarussalamBulgariaBurkina FasoBurundiCabo VerdeCambodiaCameroonCanadaCaribbean small statesCayman IslandsCentral African RepublicCentral Europe and the BalticsChadChileChinaColombiaComorosCongo, Dem. Rep.Congo, Rep.Costa RicaCote d'IvoireCroatiaCubaCyprusCzech RepublicDenmarkDjiboutiDominicaDominican RepublicEarly-demographic dividendEast Asia & PacificEast Asia & Pacific (excluding high income)East Asia & Pacific (IDA & IBRD countries)EcuadorEgypt, Arab Rep.El SalvadorEquatorial GuineaEritreaEstoniaEthiopiaEuro areaEurope & Central AsiaEurope & Central Asia (excluding high income)Europe & Central Asia (IDA & IBRD countries)European UnionFijiFinlandFragile and conflict affected situationsFranceGabonGambia, TheGeorgiaGermanyGhanaGreeceGrenadaGuatemalaGuineaGuinea-BissauGuyanaHaitiHeavily indebted poor countries (HIPC)High incomeHondurasHong Kong SAR, ChinaHungaryIBRD onlyIcelandIDA & IBRD totalIDA blendIDA onlyIDA totalIndiaIndonesiaIran, Islamic Rep.IraqIrelandItalyJamaicaJapanJordanKazakhstanKenyaKiribatiKorea, Rep.KosovoKuwaitKyrgyz RepublicLao PDRLate-demographic dividendLatin America & Caribbean Latin America & Caribbean (excluding high income)Latin America & the Caribbean (IDA & IBRD countries)LatviaLeast developed countries: UN classificationLebanonLesothoLiberiaLithuaniaLow & middle incomeLow incomeLower middle incomeLuxembourgMacedonia, FYRMadagascarMalawiMalaysiaMaldivesMaliMarshall IslandsMauritaniaMauritiusMexicoMicronesia, Fed. Sts.Middle East & North AfricaMiddle East & North Africa (excluding high income)Middle East & North Africa (IDA & IBRD countries)Middle incomeMoldovaMongoliaMontenegroMoroccoMozambiqueMyanmarNamibiaNepalNetherlandsNew ZealandNicaraguaNigerNigeriaNorth AmericaNorwayOECD membersOmanOther small statesPakistanPalauPanamaPapua New GuineaParaguayPeruPhilippinesPolandPortugalPost-demographic dividendPre-demographic dividendPuerto RicoQatarRomaniaRussian FederationRwandaSamoaSao Tome and PrincipeSaudi ArabiaSenegalSerbiaSeychellesSierra LeoneSingaporeSlovak RepublicSloveniaSmall statesSolomon IslandsSomaliaSouth AfricaSouth AsiaSouth Asia (IDA & IBRD)SpainSri LankaSt. Kitts and NevisSt. LuciaSt. Vincent and the GrenadinesSub-Saharan Africa Sub-Saharan Africa (excluding high income)Sub-Saharan Africa (IDA & IBRD countries)SudanSurinameSwazilandSwedenSwitzerlandSyrian Arab RepublicTajikistanTanzaniaThailandTimor-LesteTogoTongaTrinidad and TobagoTunisiaTurkeyTurkmenistanTuvaluUgandaUkraineUnited Arab EmiratesUnited KingdomUnited StatesUpper middle incomeUruguayUzbekistanVanuatuVenezuela, RBVietnamWest Bank and GazaWorldZambiaZimbabwe línea de tiempo (timeline):
En esta escala de tiempo se presenta un gráfico de 1967 y 2016 de Low & middle income. Los datos de 1966 están ausentes. El número de observaciones reales por fecha: 50.
Fuente (nombre):
Indicadores del desarrollo mundial
Fuente (organización):
World Bank national accounts data, and OECD National Accounts data files.
Categorías:
Economy & Growth
Se ha actualizado:
23 abr 2017 año
Los indicadores de los cambios de valor en los últimos años
Mínimo:
0.168
1 ene 1973 año
Máximo:
5.491
1 ene 1968 año
A la fecha de observación
Valor
Cambio absoluto
El cambio con respecto al valor anterior
1 ene 1967 año
1.734
+1.734
0.0%
1 ene 1968 año
5.491
+3.757
216.73%
1 ene 1969 año
1.894
-3.597
-65.51%
1 ene 1970 año
2.924
+1.03
54.37%
1 ene 1971 año
5.108
+2.184
74.72%
1 ene 1972 año
2.324
-2.784
-54.51%
1 ene 1973 año
0.168
-2.156
-92.78%
1 ene 1974 año
4.663
+4.496
2.68 mil%
1 ene 1975 año
3.215
-1.448
-31.06%
1 ene 1976 año
4.142
+0.927
28.82%
1 ene 1977 año
1.026
-3.116
-75.23%
1 ene 1978 año
2.714
+1.688
164.51%
1 ene 1979 año
3.47
+0.757
27.89%
1 ene 1980 año
0.212
-3.258
-93.88%
1 ene 1981 año
3.776
+3.564
1.68 mil%
1 ene 1982 año
4.645
+0.869
23.02%
1 ene 1983 año
4.06
-0.585
-12.59%
1 ene 1984 año
3.809
-0.251
-6.18%
1 ene 1985 año
5.157
+1.348
35.39%
1 ene 1986 año
2.807
-2.35
-45.57%
1 ene 1987 año
2.392
-0.415
-14.78%
1 ene 1988 año
2.536
+0.144
6.03%
1 ene 1989 año
5.313
+2.776
109.46%
1 ene 1990 año
2.704
-2.609
-49.11%
1 ene 1991 año
3.769
+1.065
39.39%
1 ene 1992 año
0.431
-3.338
-88.57%
1 ene 1993 año
2.763
+2.332
541.38%
1 ene 1994 año
1.86
-0.903
-32.68%
1 ene 1995 año
1.863
+0.003
0.16%
1 ene 1996 año
2.071
+0.208
11.18%
1 ene 1997 año
5.167
+3.096
149.46%
1 ene 1998 año
1.028
-4.138
-80.1%
1 ene 1999 año
2.564
+1.535
149.3%
1 ene 2000 año
3.018
+0.454
17.72%
1 ene 2001 año
2.187
-0.831
-27.53%
1 ene 2002 año
3.481
+1.294
59.14%
1 ene 2003 año
2.771
-0.71
-20.4%
1 ene 2004 año
4.048
+1.277
46.1%
1 ene 2005 año
3.653
-0.395
-9.75%
1 ene 2006 año
4.354
+0.7
19.17%
1 ene 2007 año
4.791
+0.437
10.05%
1 ene 2008 año
2.603
-2.188
-45.66%
1 ene 2009 año
3.205
+0.602
23.13%
1 ene 2010 año
2.023
-1.182
-36.87%
1 ene 2011 año
4.269
+2.245
110.96%
1 ene 2012 año
4.473
+0.204
4.79%
1 ene 2013 año
2.617
-1.856
-41.5%
1 ene 2014 año
4.26
+1.643
62.8%
1 ene 2015 año
2.608
-1.652
-38.77%
1 ene 2016 año
2.831
+0.223
8.55%
Ranking de los países por los datos estadísticos actuales


Comentarios: