30
/es/
AIzaSyAYiBZKx7MnpbEhh9jyipgxe19OcubqV5w
April 1, 2024
44153
Least developed countries: UN classification
LDC
false
2
1
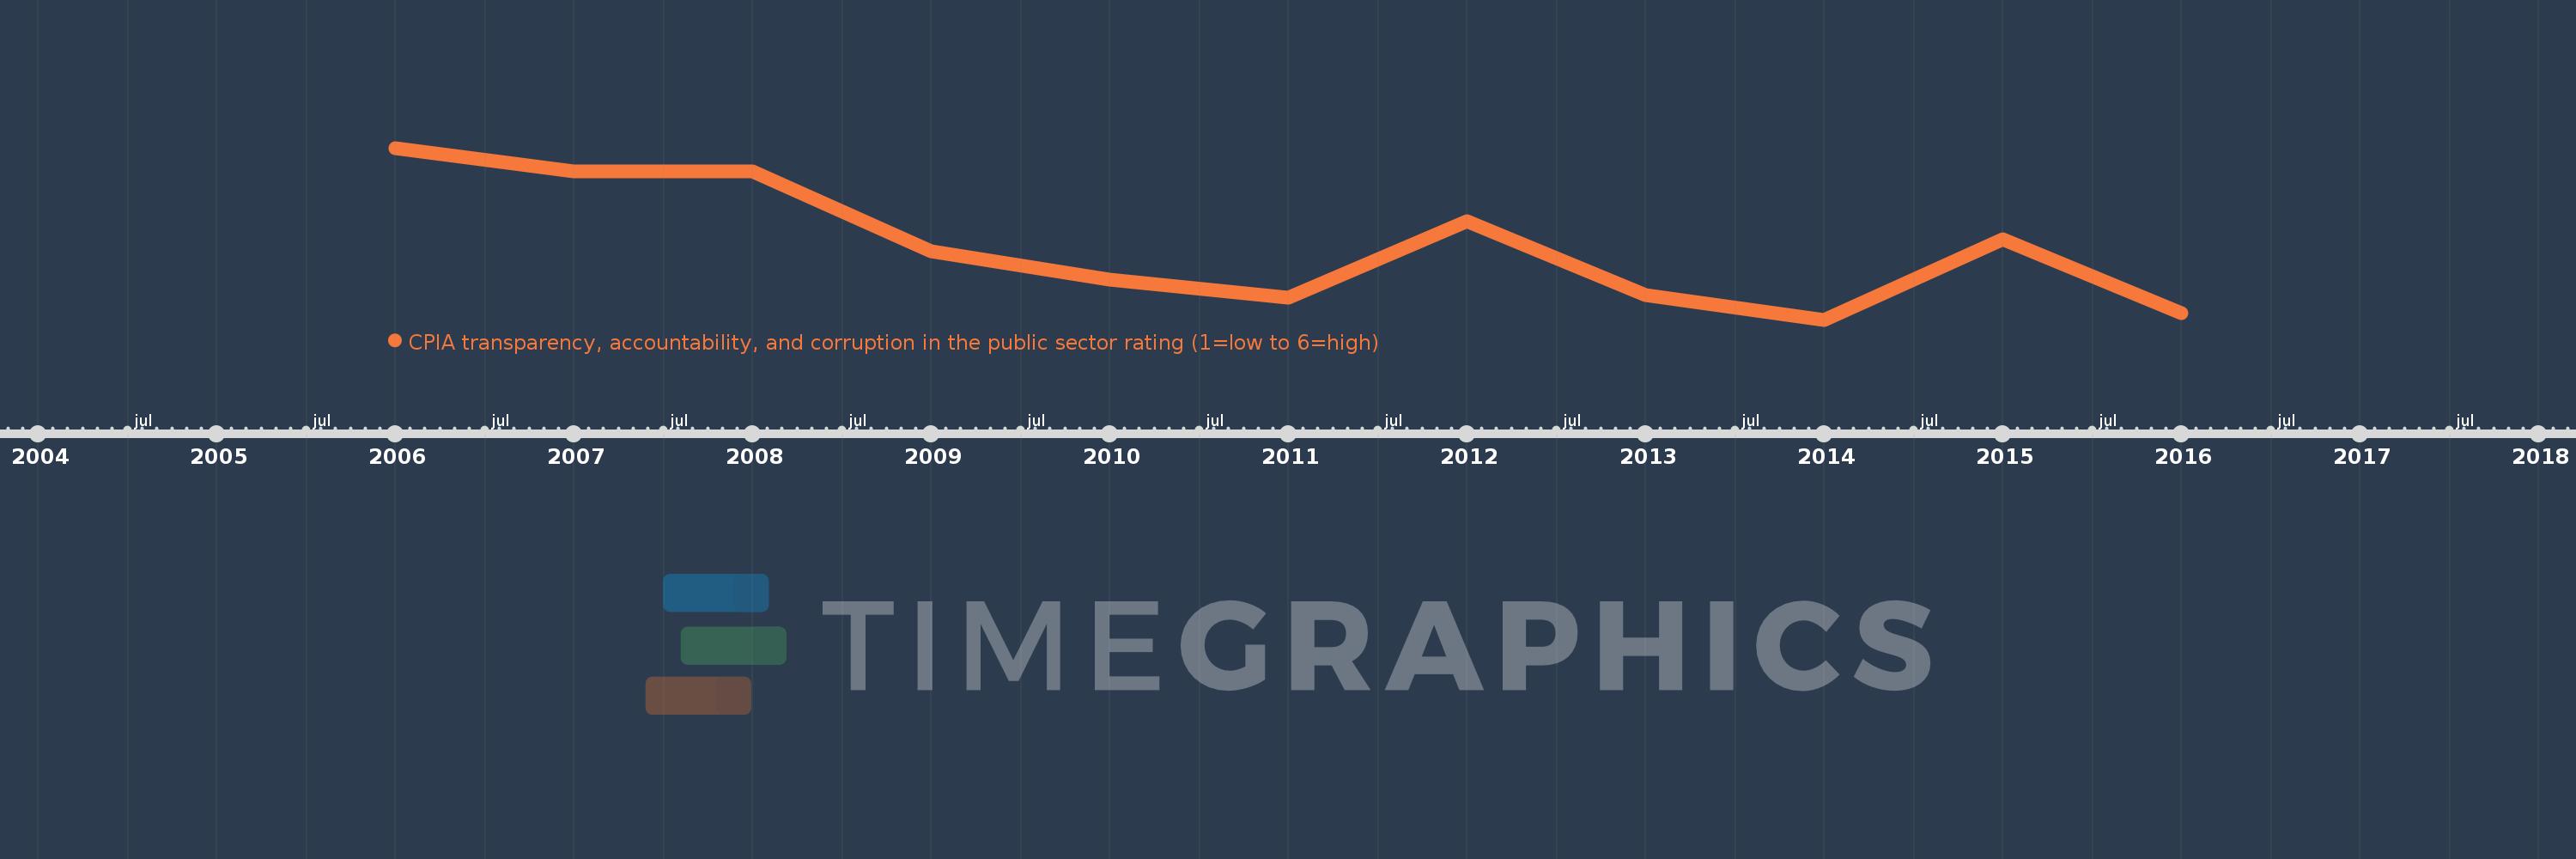
CPIA transparency, accountability, and corruption in the public sector rating (1=low to 6=high)
2016,2015,2014,2013,2012,2011,2010,2009,2008,2007,2006
