29
/es/
es
AIzaSyAYiBZKx7MnpbEhh9jyipgxe19OcubqV5w
April 1, 2024
43873
Latin America & the Caribbean (IDA & IBRD countries)
TLA
false
2
1
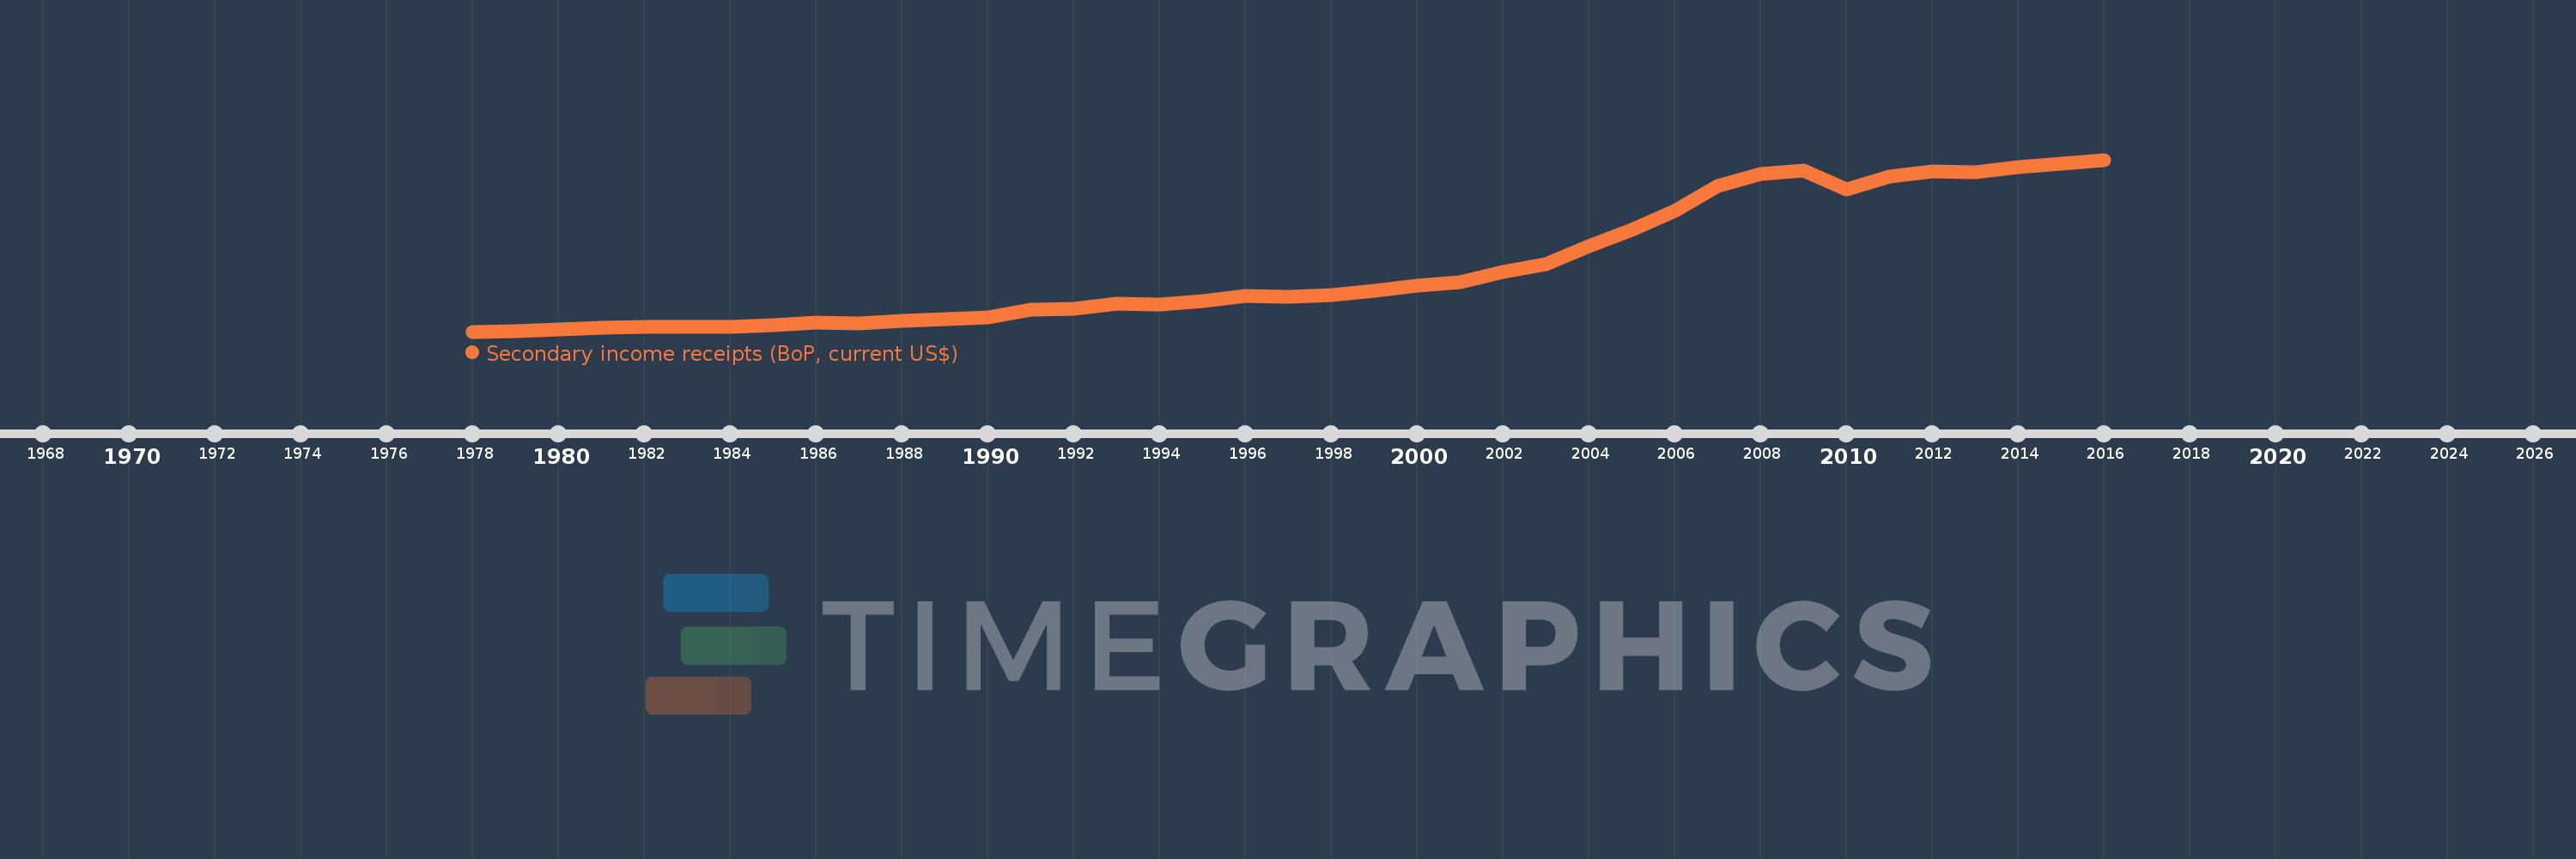
Secondary income receipts (BoP, current US$)
2016,2015,2014,2013,2012,2011,2010,2009,2008,2007,2006,2005,2004,2003,2002,2001,2000,1999,1998,1997,1996,1995,1994,1993,1992,1991,1990,1989,1988,1987,1986,1985,1984,1983,1982,1981,1980,1979,1978
Estas estadísticas en otros países:
AfghanistanAlbaniaAlgeriaAngolaAntigua and BarbudaArab WorldArgentinaArmeniaArubaAustraliaAustriaAzerbaijanBahamas, TheBahrainBangladeshBarbadosBelarusBelgiumBelizeBeninBermudaBhutanBoliviaBosnia and HerzegovinaBotswanaBrazilBrunei DarussalamBulgariaBurkina FasoBurundiCabo VerdeCambodiaCameroonCanadaCaribbean small statesCentral African RepublicCentral Europe and the BalticsChadChileChinaColombiaComorosCongo, Dem. Rep.Congo, Rep.Costa RicaCote d'IvoireCroatiaCuracaoCyprusCzech RepublicDenmarkDjiboutiDominicaDominican RepublicEarly-demographic dividendEast Asia & PacificEast Asia & Pacific (excluding high income)East Asia & Pacific (IDA & IBRD countries)EcuadorEgypt, Arab Rep.El SalvadorEquatorial GuineaEritreaEstoniaEthiopiaEuro areaEurope & Central AsiaEurope & Central Asia (excluding high income)Europe & Central Asia (IDA & IBRD countries)European UnionFaroe IslandsFijiFinlandFragile and conflict affected situationsFranceFrench PolynesiaGabonGambia, TheGeorgiaGermanyGhanaGreeceGrenadaGuatemalaGuineaGuinea-BissauGuyanaHaitiHeavily indebted poor countries (HIPC)High incomeHondurasHong Kong SAR, ChinaHungaryIBRD onlyIcelandIDA & IBRD totalIDA blendIDA onlyIDA totalIndiaIndonesiaIran, Islamic Rep.IraqIrelandIsraelItalyJamaicaJapanJordanKazakhstanKenyaKiribatiKorea, Rep.KosovoKuwaitKyrgyz RepublicLao PDRLate-demographic dividendLatin America & Caribbean Latin America & Caribbean (excluding high income)Latin America & the Caribbean (IDA & IBRD countries)LatviaLeast developed countries: UN classificationLebanonLesothoLiberiaLibyaLithuaniaLow & middle incomeLow incomeLower middle incomeLuxembourgMacao SAR, ChinaMacedonia, FYRMadagascarMalawiMalaysiaMaldivesMaliMaltaMarshall IslandsMauritaniaMauritiusMexicoMicronesia, Fed. Sts.Middle East & North AfricaMiddle East & North Africa (excluding high income)Middle East & North Africa (IDA & IBRD countries)Middle incomeMoldovaMongoliaMontenegroMoroccoMozambiqueMyanmarNamibiaNepalNetherlandsNew CaledoniaNew ZealandNicaraguaNigerNigeriaNorth AmericaNorwayOECD membersOmanOther small statesPacific island small statesPakistanPalauPanamaPapua New GuineaParaguayPeruPhilippinesPolandPortugalPost-demographic dividendPre-demographic dividendQatarRomaniaRussian FederationRwandaSamoaSao Tome and PrincipeSaudi ArabiaSenegalSerbiaSeychellesSierra LeoneSingaporeSint Maarten (Dutch part)Slovak RepublicSloveniaSmall statesSolomon IslandsSouth AfricaSouth AsiaSouth Asia (IDA & IBRD)South SudanSpainSri LankaSt. Kitts and NevisSt. LuciaSt. Vincent and the GrenadinesSub-Saharan Africa Sub-Saharan Africa (excluding high income)Sub-Saharan Africa (IDA & IBRD countries)SudanSurinameSwazilandSwedenSwitzerlandSyrian Arab RepublicTajikistanTanzaniaThailandTimor-LesteTogoTongaTrinidad and TobagoTunisiaTurkeyTuvaluUgandaUkraineUnited KingdomUnited StatesUpper middle incomeUruguayVanuatuVenezuela, RBVietnamWest Bank and GazaWorldYemen, Rep.ZambiaZimbabwe línea de tiempo (timeline):
En esta escala de tiempo se presenta un gráfico de 1978 y 2016 de Latin America & the Caribbean (IDA & IBRD countries). Los datos de 1977 están ausentes. El número de observaciones reales por fecha: 39.
Fuente (nombre):
Indicadores del desarrollo mundial
Fuente (organización):
International Monetary Fund, Balance of Payments Statistics Yearbook and data files.
Categorías:
Economy & Growth
Se ha actualizado:
23 abr 2017 año
Los indicadores de los cambios de valor en los últimos años
Mínimo:
1.068 bn
1 ene 1978 año
Máximo:
80.949 bn
1 ene 2016 año
A la fecha de observación
Valor
Cambio absoluto
El cambio con respecto al valor anterior
1 ene 1978 año
1.068 bn
+1.068 bn
0.0%
1 ene 1979 año
1.341 bn
+272.641 millones
25.53%
1 ene 1980 año
2.029 bn
+688.646 millones
51.37%
1 ene 1981 año
3.016 bn
+986.628 millones
48.62%
1 ene 1982 año
3.323 bn
+307.42 millones
10.19%
1 ene 1983 año
3.179 bn
-144.179 millones
-4.34%
1 ene 1984 año
3.452 bn
+272.899 millones
8.58%
1 ene 1985 año
4.066 bn
+614.317 millones
17.8%
1 ene 1986 año
5.298 bn
+1.231 bn
30.28%
1 ene 1987 año
4.914 bn
-383.978 millones
-7.25%
1 ene 1988 año
6.214 bn
+1.3 bn
26.45%
1 ene 1989 año
6.999 bn
+785.215 millones
12.64%
1 ene 1990 año
7.689 bn
+689.719 millones
9.85%
1 ene 1991 año
11.118 bn
+3.43 bn
44.61%
1 ene 1992 año
11.804 bn
+685.471 millones
6.17%
1 ene 1993 año
14.067 bn
+2.263 bn
19.17%
1 ene 1994 año
13.764 bn
-302.854 millones
-2.15%
1 ene 1995 año
15.332 bn
+1.568 bn
11.39%
1 ene 1996 año
17.715 bn
+2.383 bn
15.54%
1 ene 1997 año
17.41 bn
-304.561 millones
-1.72%
1 ene 1998 año
18.236 bn
+825.92 millones
4.74%
1 ene 1999 año
20.221 bn
+1.985 bn
10.89%
1 ene 2000 año
22.381 bn
+2.16 bn
10.68%
1 ene 2001 año
24.127 bn
+1.745 bn
7.8%
1 ene 2002 año
28.995 bn
+4.868 bn
20.18%
1 ene 2003 año
32.613 bn
+3.618 bn
12.48%
1 ene 2004 año
40.834 bn
+8.221 bn
25.21%
1 ene 2005 año
48.365 bn
+7.53 bn
18.44%
1 ene 2006 año
57.244 bn
+8.879 bn
18.36%
1 ene 2007 año
68.837 bn
+11.593 bn
20.25%
1 ene 2008 año
74.294 bn
+5.457 bn
7.93%
1 ene 2009 año
75.908 bn
+1.614 bn
2.17%
1 ene 2010 año
67.019 bn
-8.889 bn
-11.71%
1 ene 2011 año
73.211 bn
+6.193 bn
9.24%
1 ene 2012 año
75.435 bn
+2.224 bn
3.04%
1 ene 2013 año
75.049 bn
-386.096 millones
-0.51%
1 ene 2014 año
77.461 bn
+2.412 bn
3.21%
1 ene 2015 año
79.015 bn
+1.554 bn
2.01%
1 ene 2016 año
80.949 bn
+1.934 bn
2.45%
Ranking de los países por los datos estadísticos actuales


Comentarios: