29
/es/
es
AIzaSyAYiBZKx7MnpbEhh9jyipgxe19OcubqV5w
April 1, 2024
43770
Latin America & the Caribbean (IDA & IBRD countries)
TLA
false
2
1
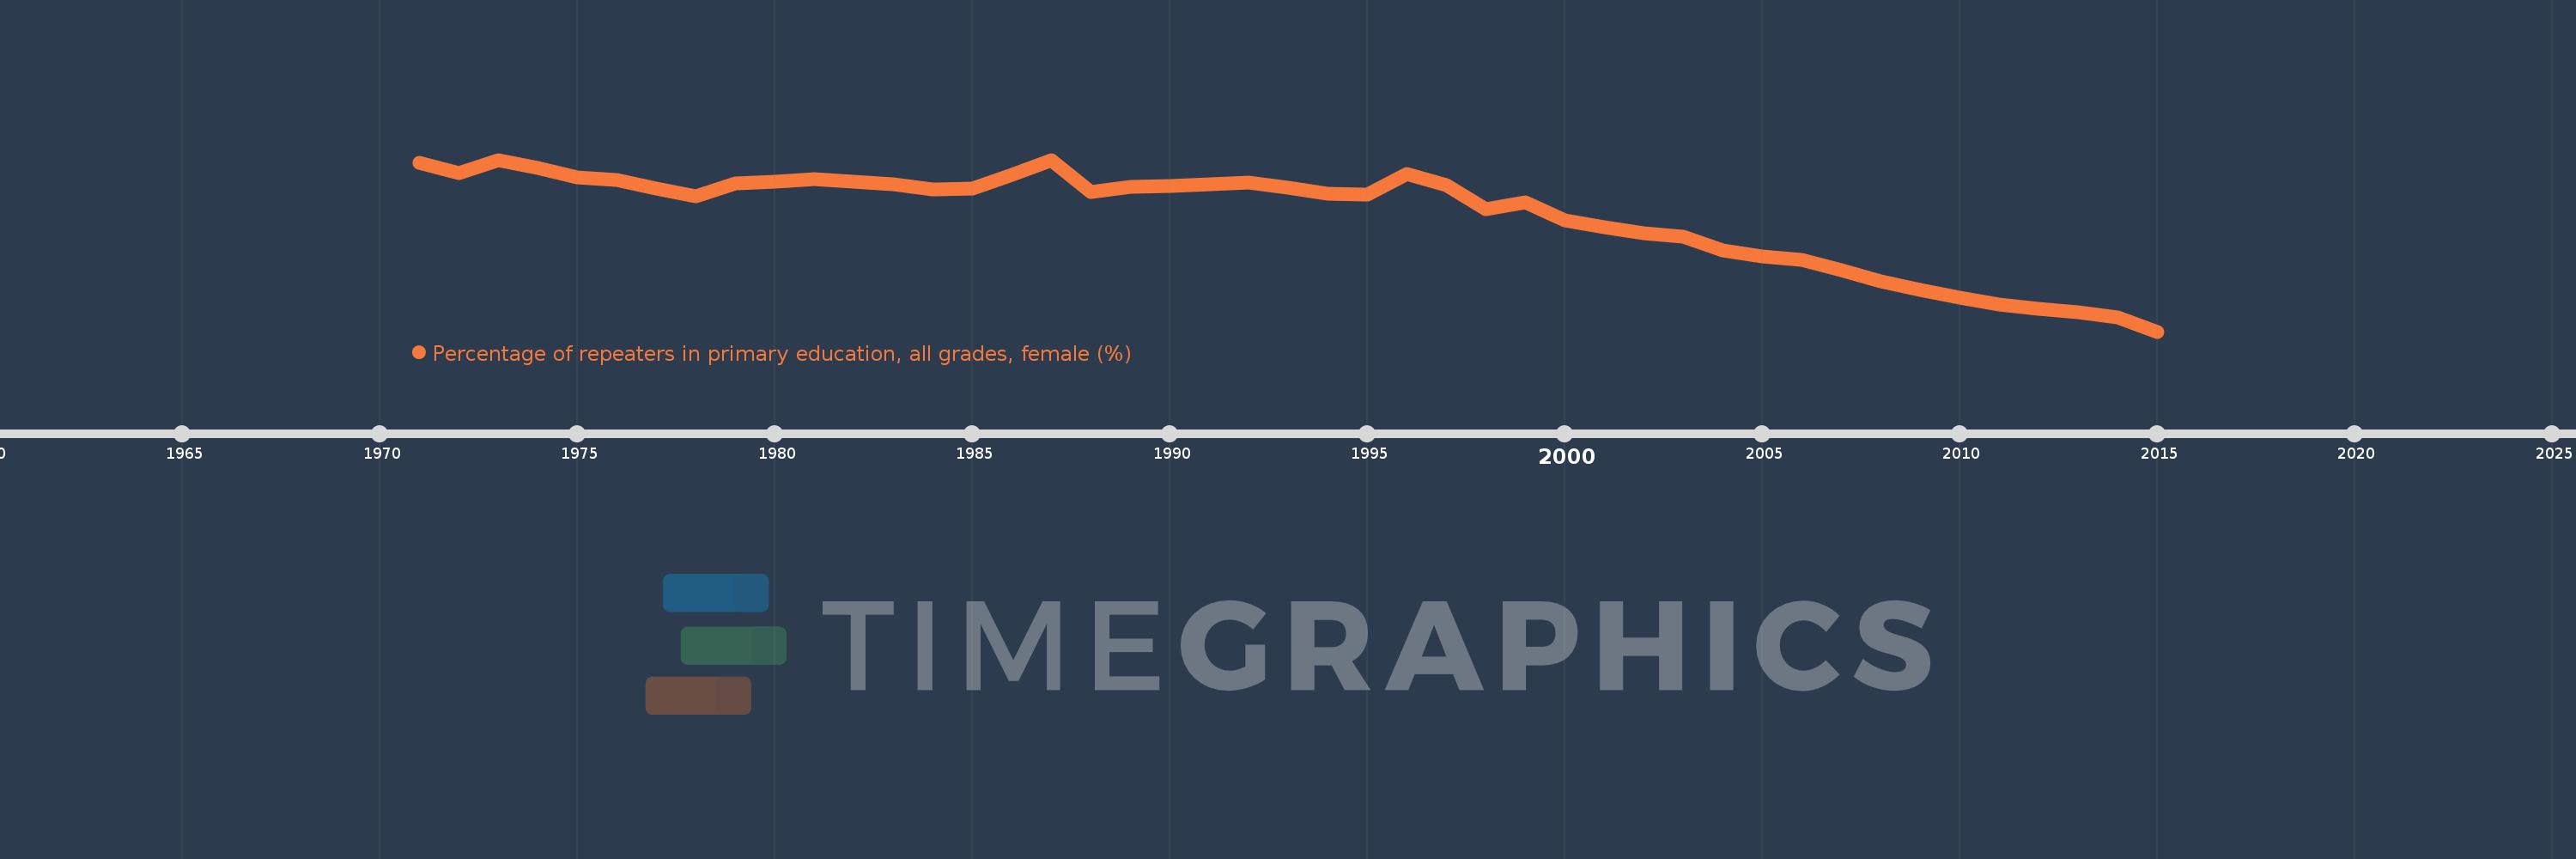
Percentage of repeaters in primary education, all grades, female (%)
2015,2014,2013,2012,2011,2010,2009,2008,2007,2006,2005,2004,2003,2002,2001,2000,1999,1998,1997,1996,1995,1994,1993,1992,1991,1990,1989,1988,1987,1986,1985,1984,1983,1982,1981,1980,1979,1978,1977,1976,1975,1974,1973,1972,1971
Estas estadísticas en otros países:
AfghanistanAlbaniaAlgeriaAndorraAngolaAntigua and BarbudaArab WorldArgentinaArmeniaArubaAustriaAzerbaijanBahamas, TheBahrainBangladeshBelarusBelgiumBelizeBeninBermudaBhutanBoliviaBosnia and HerzegovinaBotswanaBrazilBritish Virgin IslandsBrunei DarussalamBulgariaBurkina FasoBurundiCabo VerdeCambodiaCameroonCanadaCaribbean small statesCayman IslandsCentral African RepublicCentral Europe and the BalticsChadChileChinaColombiaComorosCongo, Dem. Rep.Congo, Rep.Costa RicaCote d'IvoireCroatiaCubaCyprusCzech RepublicDenmarkDjiboutiDominicaDominican RepublicEarly-demographic dividendEast Asia & PacificEast Asia & Pacific (excluding high income)East Asia & Pacific (IDA & IBRD countries)EcuadorEgypt, Arab Rep.El SalvadorEquatorial GuineaEritreaEstoniaEthiopiaEuro areaEurope & Central AsiaEurope & Central Asia (excluding high income)Europe & Central Asia (IDA & IBRD countries)European UnionFijiFinlandFragile and conflict affected situationsFranceGabonGambia, TheGeorgiaGermanyGhanaGreeceGrenadaGuatemalaGuineaGuinea-BissauGuyanaHaitiHeavily indebted poor countries (HIPC)High incomeHondurasHong Kong SAR, ChinaHungaryIBRD onlyIcelandIDA & IBRD totalIDA blendIDA onlyIDA totalIndiaIndonesiaIran, Islamic Rep.IraqIrelandIsraelItalyJamaicaJapanJordanKazakhstanKenyaKiribatiKorea, Rep.KuwaitKyrgyz RepublicLao PDRLate-demographic dividendLatin America & Caribbean Latin America & Caribbean (excluding high income)Latin America & the Caribbean (IDA & IBRD countries)LatviaLeast developed countries: UN classificationLebanonLesothoLiberiaLibyaLiechtensteinLithuaniaLow & middle incomeLow incomeLower middle incomeLuxembourgMacao SAR, ChinaMacedonia, FYRMadagascarMalawiMalaysiaMaldivesMaliMaltaMauritaniaMauritiusMexicoMiddle East & North AfricaMiddle East & North Africa (excluding high income)Middle East & North Africa (IDA & IBRD countries)Middle incomeMoldovaMonacoMongoliaMontenegroMoroccoMozambiqueMyanmarNamibiaNauruNepalNetherlandsNew ZealandNicaraguaNigerNorwayOECD membersOmanOther small statesPacific island small statesPakistanPalauPanamaPapua New GuineaParaguayPeruPhilippinesPolandPortugalPost-demographic dividendPre-demographic dividendQatarRomaniaRussian FederationRwandaSamoaSan MarinoSao Tome and PrincipeSaudi ArabiaSenegalSerbiaSeychellesSierra LeoneSingaporeSint Maarten (Dutch part)Slovak RepublicSloveniaSmall statesSolomon IslandsSomaliaSouth AfricaSouth AsiaSouth Asia (IDA & IBRD)South SudanSpainSri LankaSt. Kitts and NevisSt. LuciaSt. Vincent and the GrenadinesSub-Saharan Africa Sub-Saharan Africa (excluding high income)Sub-Saharan Africa (IDA & IBRD countries)SudanSurinameSwazilandSwedenSwitzerlandSyrian Arab RepublicTajikistanTanzaniaThailandTimor-LesteTogoTongaTrinidad and TobagoTunisiaTurkeyTurks and Caicos IslandsTuvaluUgandaUkraineUnited Arab EmiratesUnited KingdomUpper middle incomeUruguayUzbekistanVanuatuVenezuela, RBVietnamWest Bank and GazaWorldYemen, Rep.ZambiaZimbabwe línea de tiempo (timeline):
En esta escala de tiempo se presenta un gráfico de 1971 y 2015 de Latin America & the Caribbean (IDA & IBRD countries). Los datos de 1970 están ausentes. El número de observaciones reales por fecha: 45.
Fuente (nombre):
Indicadores del desarrollo mundial
Fuente (organización):
UNESCO Institute for Statistics
Categorías:
Education, Gender
Se ha actualizado:
23 abr 2017 año
Los indicadores de los cambios de valor en los últimos años
Mínimo:
8.254
1 ene 2015 año
Máximo:
13.248
1 ene 1973 año
A la fecha de observación
Valor
Cambio absoluto
El cambio con respecto al valor anterior
1 ene 1971 año
13.153
+13.153
0.0%
1 ene 1972 año
12.854
-0.298
-2.27%
1 ene 1973 año
13.248
+0.394
3.06%
1 ene 1974 año
13.003
-0.245
-1.85%
1 ene 1975 año
12.731
-0.272
-2.09%
1 ene 1976 año
12.652
-0.079
-0.62%
1 ene 1977 año
12.412
-0.24
-1.9%
1 ene 1978 año
12.175
-0.237
-1.91%
1 ene 1979 año
12.563
+0.388
3.19%
1 ene 1980 año
12.605
+0.041
0.33%
1 ene 1981 año
12.698
+0.093
0.74%
1 ene 1982 año
12.599
-0.099
-0.78%
1 ene 1983 año
12.533
-0.066
-0.52%
1 ene 1984 año
12.388
-0.145
-1.16%
1 ene 1985 año
12.409
+0.021
0.17%
1 ene 1986 año
12.801
+0.392
3.16%
1 ene 1987 año
13.231
+0.43
3.36%
1 ene 1988 año
12.32
-0.911
-6.88%
1 ene 1989 año
12.471
+0.151
1.23%
1 ene 1990 año
12.479
+0.008
0.06%
1 ene 1991 año
12.547
+0.068
0.55%
1 ene 1992 año
12.574
+0.027
0.21%
1 ene 1993 año
12.427
-0.147
-1.17%
1 ene 1994 año
12.25
-0.178
-1.43%
1 ene 1995 año
12.228
-0.021
-0.17%
1 ene 1996 año
12.834
+0.606
4.95%
1 ene 1997 año
12.503
-0.331
-2.58%
1 ene 1998 año
11.802
-0.701
-5.61%
1 ene 1999 año
12.014
+0.212
1.8%
1 ene 2000 año
11.496
-0.518
-4.31%
1 ene 2001 año
11.287
-0.209
-1.82%
1 ene 2002 año
11.11
-0.177
-1.57%
1 ene 2003 año
11.014
-0.095
-0.86%
1 ene 2004 año
10.607
-0.407
-3.7%
1 ene 2005 año
10.45
-0.157
-1.48%
1 ene 2006 año
10.332
-0.118
-1.13%
1 ene 2007 año
10.049
-0.283
-2.74%
1 ene 2008 año
9.717
-0.332
-3.31%
1 ene 2009 año
9.468
-0.249
-2.56%
1 ene 2010 año
9.237
-0.231
-2.44%
1 ene 2011 año
9.051
-0.185
-2.01%
1 ene 2012 año
8.919
-0.132
-1.45%
1 ene 2013 año
8.826
-0.094
-1.05%
1 ene 2014 año
8.663
-0.163
-1.85%
1 ene 2015 año
8.254
-0.408
-4.72%
Ranking de los países por los datos estadísticos actuales


Comentarios: