30
/es/
AIzaSyAYiBZKx7MnpbEhh9jyipgxe19OcubqV5w
April 1, 2024
42961
Latin America & Caribbean (excluding high income)
LAC
false
2
1
Researchers in R&D (per million people)
2011,2010,2009,2008,2007,2006,2005,2004,2003,2002,2001
Download
Estadísticas Globales de la Biblioteca →Latin America & Caribbean (excluding high income) →

Researchers in R&D (per million people)

Estas estadísticas en otros países:

AlbaniaAlgeriaAmerican SamoaAngolaArgentinaAustraliaAustriaBahrainBelgiumBoliviaBosnia and HerzegovinaBotswanaBrazilBrunei DarussalamBulgariaBurkina FasoCabo VerdeCambodiaCanadaCentral Europe and the BalticsChileChinaColombiaCongo, Rep.Costa RicaCote d'IvoireCroatiaCyprusCzech RepublicDenmarkEarly-demographic dividendEast Asia & PacificEast Asia & Pacific (excluding high income)East Asia & Pacific (IDA & IBRD countries)EcuadorEgypt, Arab Rep.EstoniaEthiopiaEuro areaEurope & Central AsiaEurope & Central Asia (excluding high income)Europe & Central Asia (IDA & IBRD countries)European UnionFaroe IslandsFinlandFranceGambia, TheGeorgiaGermanyGhanaGreeceGreenlandGuamGuatemalaHigh incomeHong Kong SAR, ChinaHungaryIBRD onlyIcelandIDA & IBRD totalIndiaIndonesiaIran, Islamic Rep.IraqIrelandIsraelItalyJapanJordanKazakhstanKenyaKorea, Rep.KuwaitLao PDRLate-demographic dividendLatin America & Caribbean Latin America & Caribbean (excluding high income)Latin America & the Caribbean (IDA & IBRD countries)LatviaLesothoLithuaniaLow & middle incomeLuxembourgMacao SAR, ChinaMacedonia, FYRMadagascarMalawiMalaysiaMaliMaltaMauritiusMexicoMiddle East & North Africa (excluding high income)Middle East & North Africa (IDA & IBRD countries)Middle incomeMoldovaMontenegroMoroccoMozambiqueMyanmarNepalNetherlandsNew ZealandNicaraguaNigerNigeriaNorth AmericaNorwayOECD membersOmanPakistanPanamaParaguayPhilippinesPolandPortugalPost-demographic dividendPuerto RicoQatarRomaniaRussian FederationRwandaSenegalSerbiaSeychellesSingaporeSlovak RepublicSloveniaSouth AfricaSouth AsiaSouth Asia (IDA & IBRD)SpainSri LankaSwedenSwitzerlandTanzaniaThailandTogoTunisiaTurkeyUgandaUkraineUnited KingdomUnited StatesUpper middle incomeUruguayUzbekistanVenezuela, RBVietnamWest Bank and GazaWorldZambiaZimbabwe

línea de tiempo (timeline):

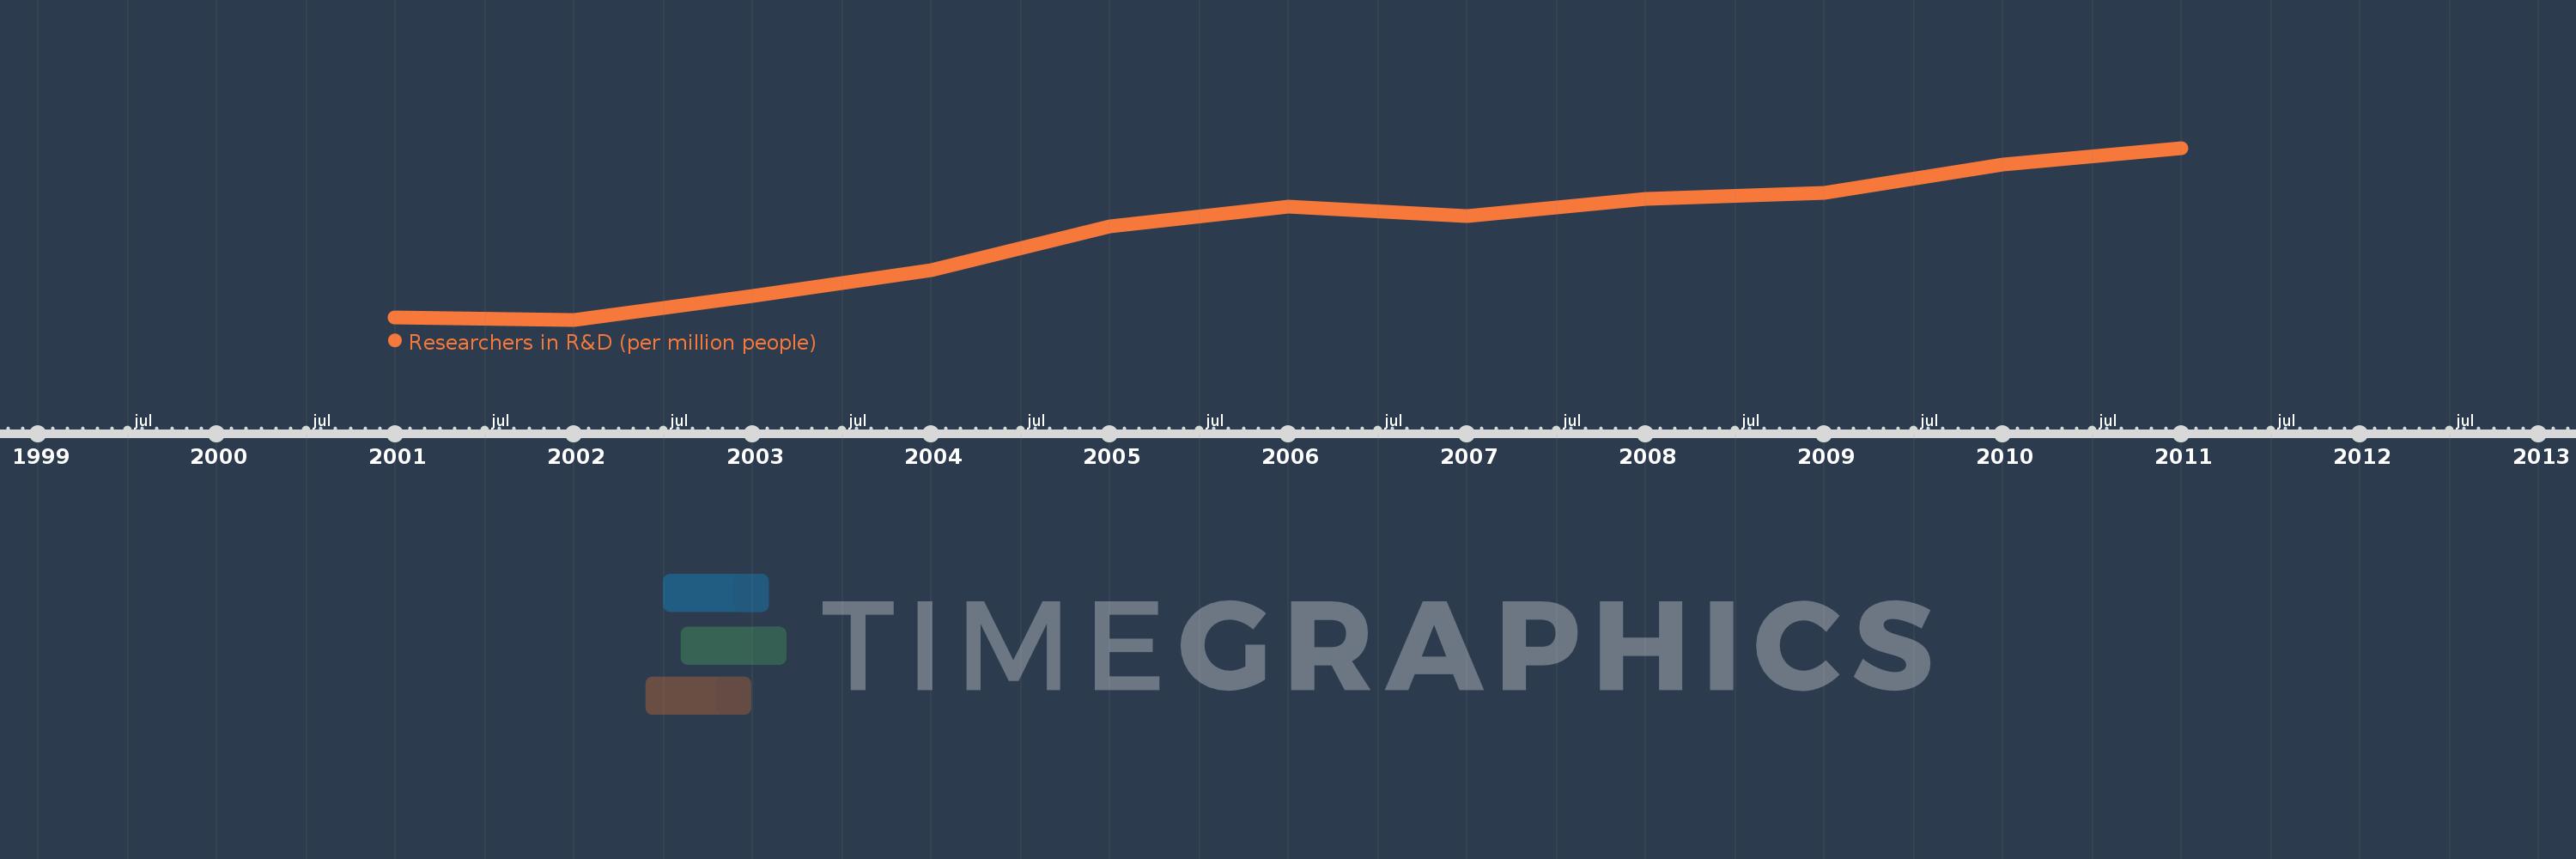
En esta escala de tiempo se presenta un gráfico de 2001 y 2011 de Latin America & Caribbean (excluding high income). Los datos de 2000 están ausentes. El número de observaciones reales por fecha: 11.

Fuente (nombre):

Indicadores del desarrollo mundial

Fuente (organización):

United Nations Educational, Scientific, and Cultural Organization (UNESCO) Institute for Statistics.

Categorías:

Science & Technology

Se ha actualizado:

23 abr 2017 año

Los indicadores de los cambios de valor en los últimos años

En promedio:
422.513
Mínimo:
326.065
1 ene 2002 año
Máximo:
515.663
1 ene 2011 año
A la fecha de observación
Valor
Cambio absoluto
El cambio con respecto al valor anterior
1 ene 2001 año
328.943
+328.943
0.0%
1 ene 2002 año
326.065
-2.878
-0.88%
1 ene 2003 año
352.777
+26.712
8.19%
1 ene 2004 año
380.985
+28.208
8.0%
1 ene 2005 año
428.922
+47.937
12.58%
1 ene 2006 año
450.691
+21.769
5.08%
1 ene 2007 año
440.821
-9.87
-2.19%
1 ene 2008 año
459.534
+18.713
4.25%
1 ene 2009 año
465.943
+6.409
1.39%
1 ene 2010 año
497.302
+31.359
6.73%
1 ene 2011 año
515.663
+18.362
3.69%

Ranking de los países por los datos estadísticos actuales