29
/es/
es
AIzaSyAYiBZKx7MnpbEhh9jyipgxe19OcubqV5w
April 1, 2024
38818
IDA only
IDX
false
2
1
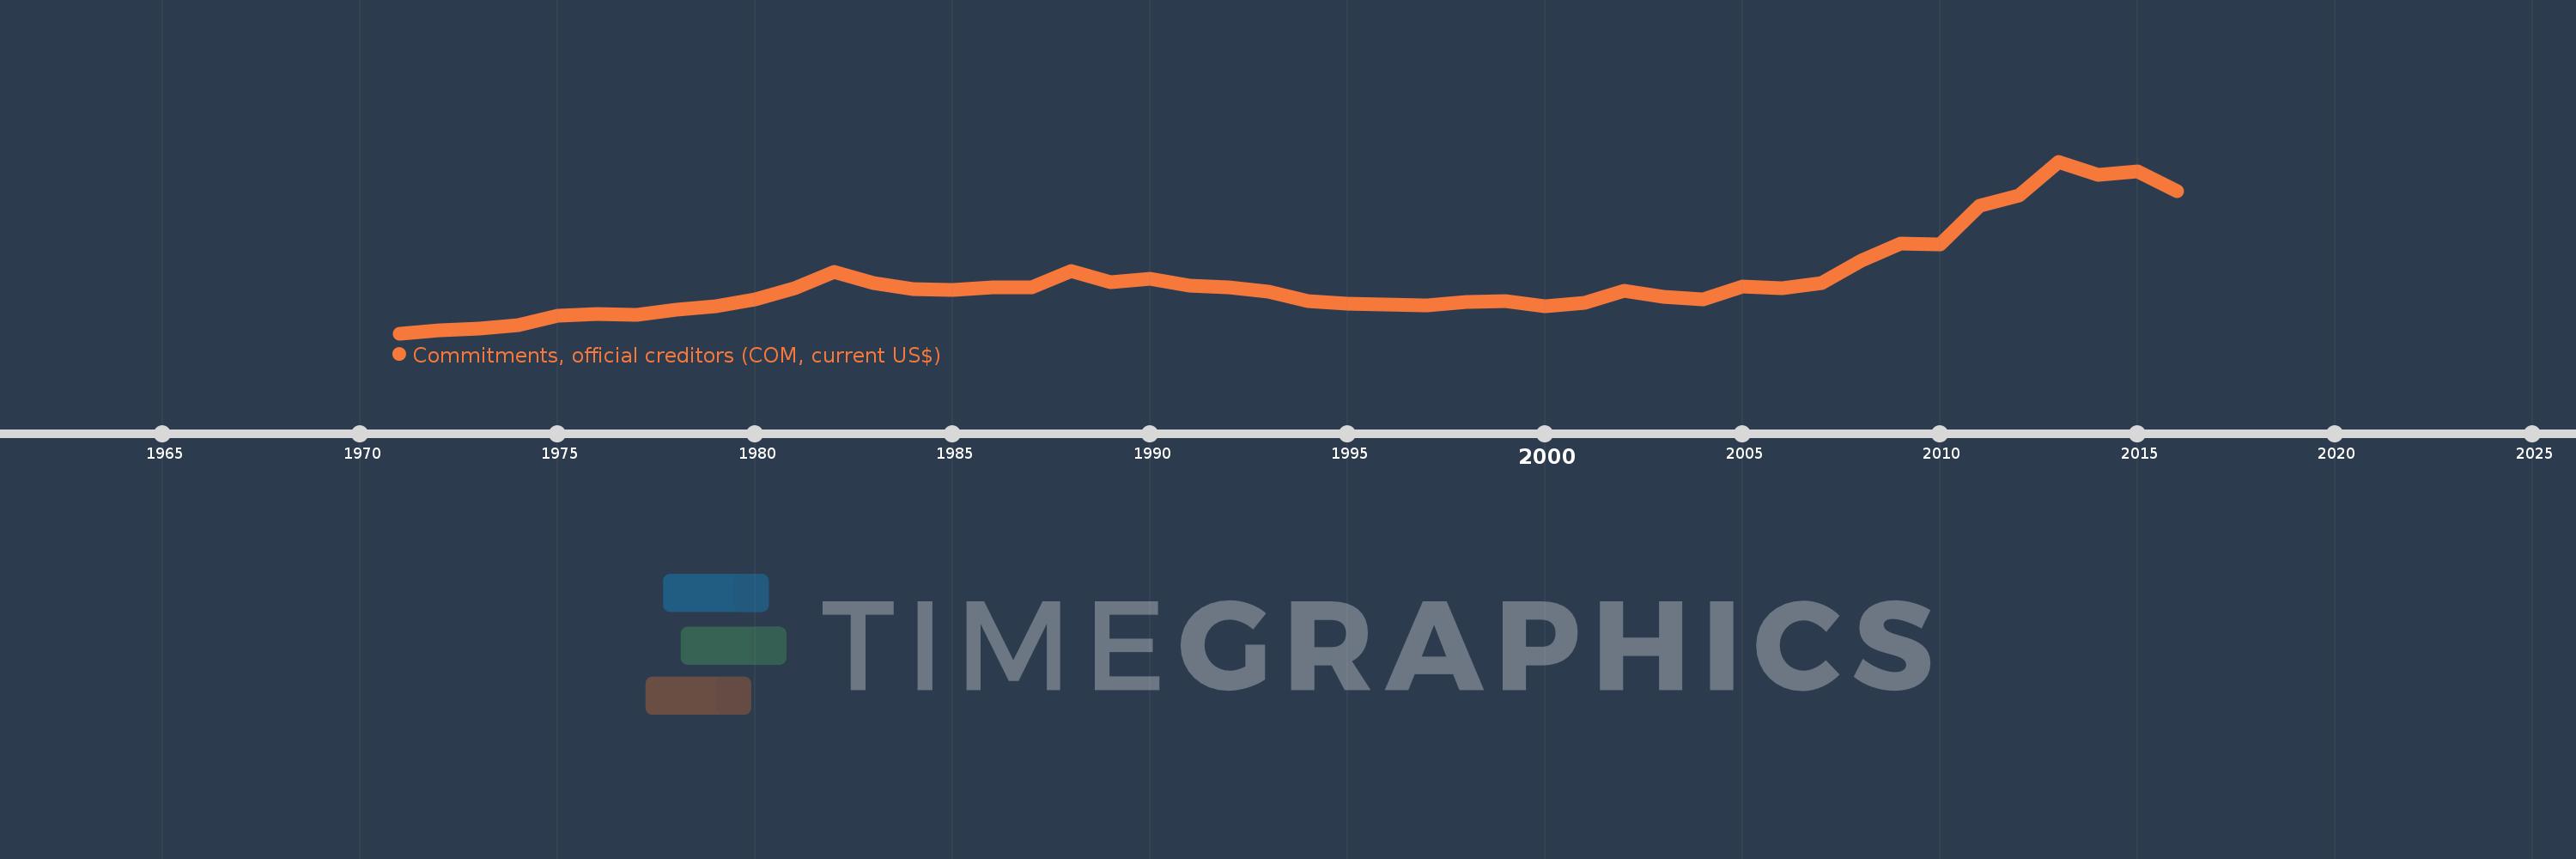
Commitments, official creditors (COM, current US$)
2016,2015,2014,2013,2012,2011,2010,2009,2008,2007,2006,2005,2004,2003,2002,2001,2000,1999,1998,1997,1996,1995,1994,1993,1992,1991,1990,1989,1988,1987,1986,1985,1984,1983,1982,1981,1980,1979,1978,1977,1976,1975,1974,1973,1972,1971
Estas estadísticas en otros países:
línea de tiempo (timeline):
En esta escala de tiempo se presenta un gráfico de 1971 y 2016 de IDA only. Los datos de 1970 están ausentes. El número de observaciones reales por fecha: 46.
Fuente (nombre):
Indicadores del desarrollo mundial
Fuente (organización):
World Bank, International Debt Statistics.
Categorías:
External Debt
Se ha actualizado:
23 abr 2017 año
Los indicadores de los cambios de valor en los últimos años
Mínimo:
1.157 bn
1 ene 1971 año
Máximo:
32.537 bn
1 ene 2013 año
A la fecha de observación
Valor
Cambio absoluto
El cambio con respecto al valor anterior
1 ene 1971 año
1.157 bn
+1.157 bn
0.0%
1 ene 1972 año
1.758 bn
+600.71 millones
51.91%
1 ene 1973 año
1.983 bn
+224.977 millones
12.8%
1 ene 1974 año
2.651 bn
+668.415 millones
33.71%
1 ene 1975 año
4.339 bn
+1.688 bn
63.65%
1 ene 1976 año
4.753 bn
+413.642 millones
9.53%
1 ene 1977 año
4.546 bn
-206.4 millones
-4.34%
1 ene 1978 año
5.485 bn
+938.245 millones
20.64%
1 ene 1979 año
6.178 bn
+693.301 millones
12.64%
1 ene 1980 año
7.327 bn
+1.15 bn
18.61%
1 ene 1981 año
9.342 bn
+2.014 bn
27.49%
1 ene 1982 año
12.337 bn
+2.995 bn
32.06%
1 ene 1983 año
10.288 bn
-2.049 bn
-16.61%
1 ene 1984 año
9.271 bn
-1.017 bn
-9.88%
1 ene 1985 año
9.062 bn
-209.259 millones
-2.26%
1 ene 1986 año
9.59 bn
+528.051 millones
5.83%
1 ene 1987 año
9.618 bn
+28.104 millones
0.29%
1 ene 1988 año
12.464 bn
+2.846 bn
29.59%
1 ene 1989 año
10.44 bn
-2.024 bn
-16.24%
1 ene 1990 año
11.127 bn
+687.005 millones
6.58%
1 ene 1991 año
9.9 bn
-1.227 bn
-11.03%
1 ene 1992 año
9.622 bn
-278.543 millones
-2.81%
1 ene 1993 año
8.703 bn
-918.101 millones
-9.54%
1 ene 1994 año
6.977 bn
-1.726 bn
-19.83%
1 ene 1995 año
6.643 bn
-334.674 millones
-4.8%
1 ene 1996 año
6.457 bn
-185.301 millones
-2.79%
1 ene 1997 año
6.314 bn
-143.38 millones
-2.22%
1 ene 1998 año
6.813 bn
+499.175 millones
7.91%
1 ene 1999 año
7.073 bn
+260.308 millones
3.82%
1 ene 2000 año
6.028 bn
-1.045 bn
-14.77%
1 ene 2001 año
6.669 bn
+641.167 millones
10.64%
1 ene 2002 año
8.977 bn
+2.308 bn
34.6%
1 ene 2003 año
7.798 bn
-1.179 bn
-13.13%
1 ene 2004 año
7.307 bn
-491.402 millones
-6.3%
1 ene 2005 año
9.702 bn
+2.395 bn
32.77%
1 ene 2006 año
9.403 bn
-298.866 millones
-3.08%
1 ene 2007 año
10.351 bn
+947.847 millones
10.08%
1 ene 2008 año
14.446 bn
+4.095 bn
39.57%
1 ene 2009 año
17.496 bn
+3.05 bn
21.11%
1 ene 2010 año
17.35 bn
-146.378 millones
-0.84%
1 ene 2011 año
24.532 bn
+7.182 bn
41.4%
1 ene 2012 año
26.339 bn
+1.806 bn
7.36%
1 ene 2013 año
32.537 bn
+6.198 bn
23.53%
1 ene 2014 año
30.049 bn
-2.488 bn
-7.65%
1 ene 2015 año
30.806 bn
+756.788 millones
2.52%
1 ene 2016 año
27.063 bn
-3.743 bn
-12.15%
Ranking de los países por los datos estadísticos actuales


Comentarios: