29
/es/
es
AIzaSyAYiBZKx7MnpbEhh9jyipgxe19OcubqV5w
April 1, 2024
37282
IDA & IBRD total
IBT
false
2
1
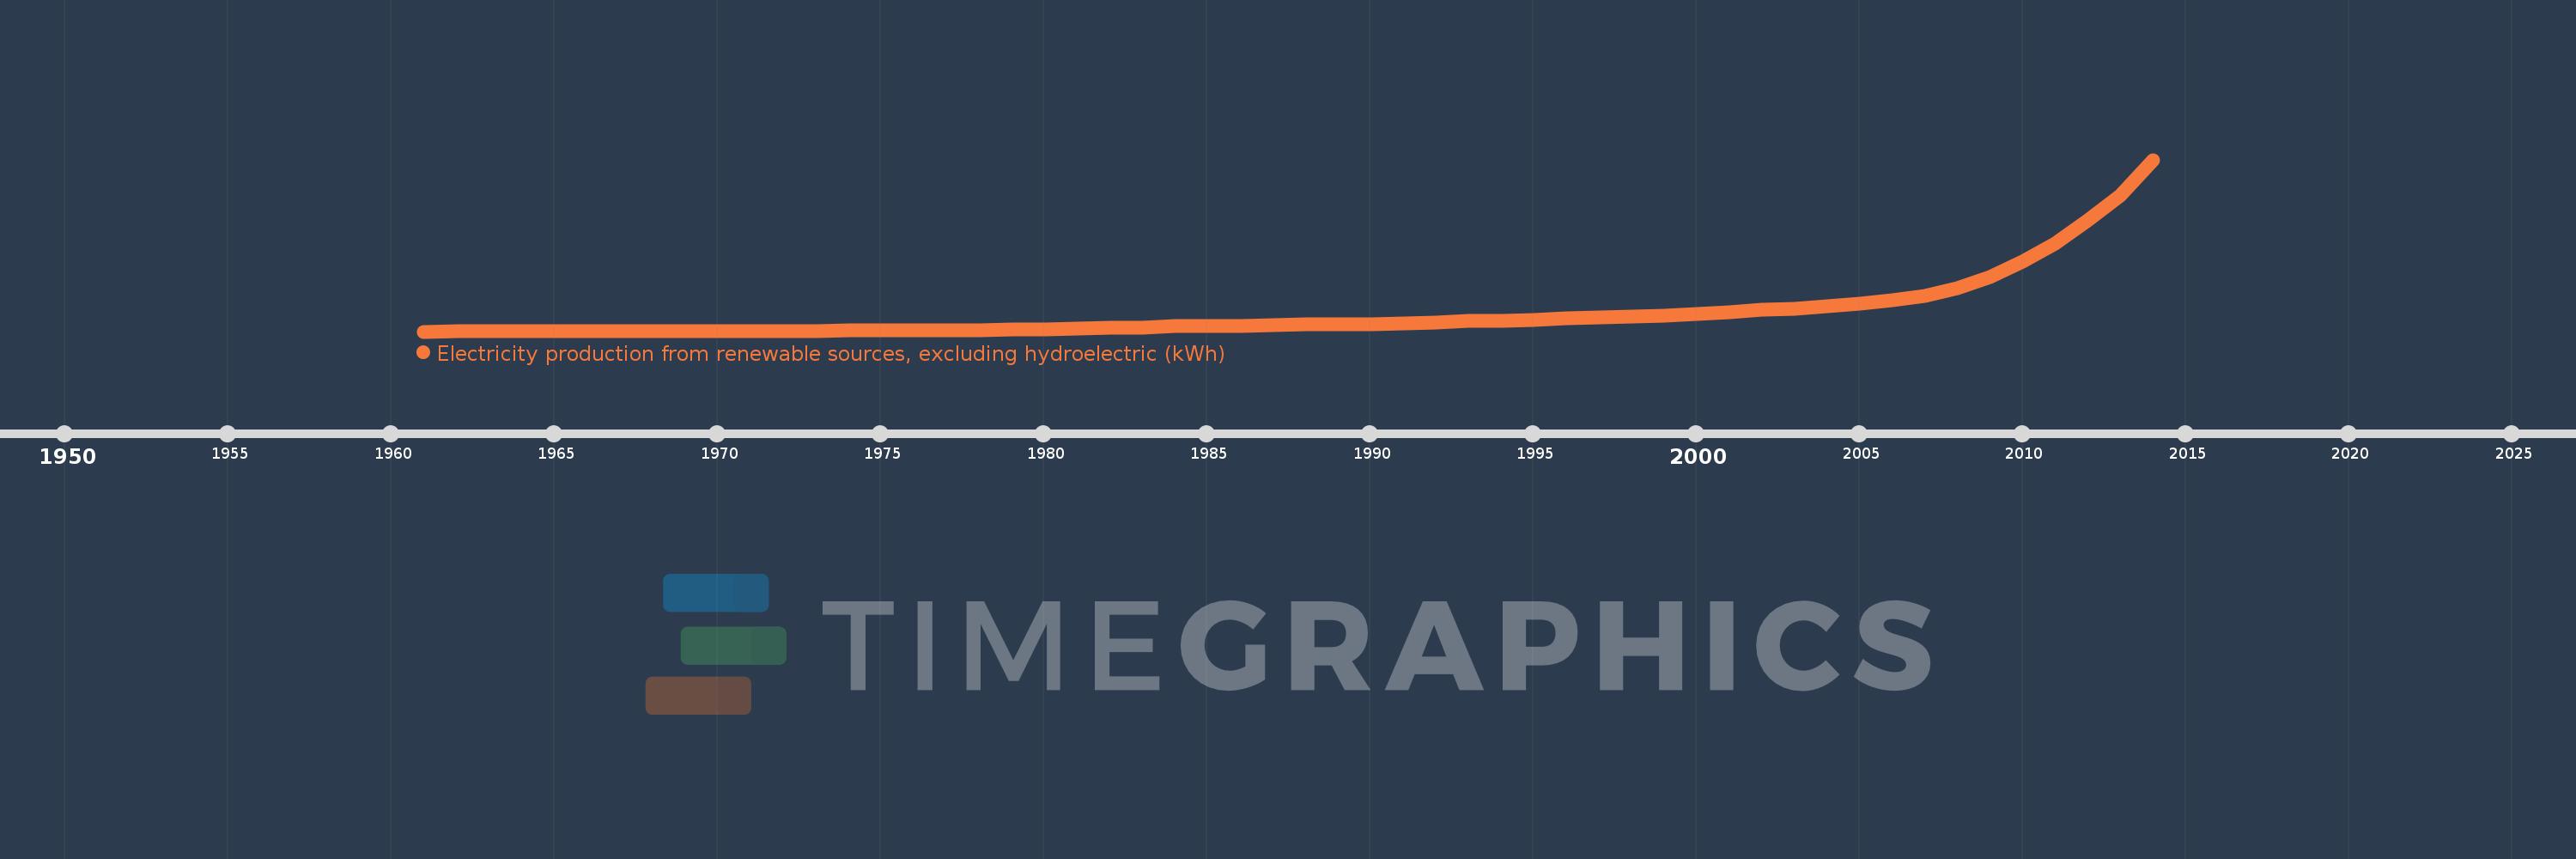
Electricity production from renewable sources, excluding hydroelectric (kWh)
2014,2013,2012,2011,2010,2009,2008,2007,2006,2005,2004,2003,2002,2001,2000,1999,1998,1997,1996,1995,1994,1993,1992,1991,1990,1989,1988,1987,1986,1985,1984,1983,1982,1981,1980,1979,1978,1977,1976,1975,1974,1973,1972,1971,1970,1969,1968,1967,1966,1965,1964,1963,1962,1961
Estas estadísticas en otros países:
AlbaniaAlgeriaAngolaArab WorldArgentinaArmeniaAustraliaAustriaAzerbaijanBahrainBangladeshBelarusBelgiumBeninBoliviaBosnia and HerzegovinaBotswanaBrazilBrunei DarussalamBulgariaCambodiaCameroonCanadaCaribbean small statesCentral Europe and the BalticsChileChinaColombiaCongo, Dem. Rep.Congo, Rep.Costa RicaCote d'IvoireCroatiaCubaCuracaoCyprusCzech RepublicDenmarkDominican RepublicEarly-demographic dividendEast Asia & PacificEast Asia & Pacific (excluding high income)East Asia & Pacific (IDA & IBRD countries)EcuadorEgypt, Arab Rep.El SalvadorEritreaEstoniaEthiopiaEuro areaEurope & Central AsiaEurope & Central Asia (excluding high income)Europe & Central Asia (IDA & IBRD countries)European UnionFinlandFragile and conflict affected situationsFranceGabonGeorgiaGermanyGhanaGibraltarGreeceGuatemalaHaitiHeavily indebted poor countries (HIPC)High incomeHondurasHong Kong SAR, ChinaHungaryIBRD onlyIcelandIDA & IBRD totalIDA blendIDA onlyIDA totalIndiaIndonesiaIran, Islamic Rep.IraqIrelandIsraelItalyJamaicaJapanJordanKazakhstanKenyaKorea, Dem. People’s Rep.Korea, Rep.KosovoKuwaitKyrgyz RepublicLate-demographic dividendLatin America & Caribbean Latin America & Caribbean (excluding high income)Latin America & the Caribbean (IDA & IBRD countries)LatviaLeast developed countries: UN classificationLebanonLibyaLithuaniaLow & middle incomeLow incomeLower middle incomeLuxembourgMacedonia, FYRMalaysiaMaltaMauritiusMexicoMiddle East & North AfricaMiddle East & North Africa (excluding high income)Middle East & North Africa (IDA & IBRD countries)Middle incomeMoldovaMongoliaMontenegroMoroccoMozambiqueMyanmarNamibiaNepalNetherlandsNew ZealandNicaraguaNigerNigeriaNorth AmericaNorwayOECD membersOmanOther small statesPakistanPanamaParaguayPeruPhilippinesPolandPortugalPost-demographic dividendPre-demographic dividendQatarRomaniaRussian FederationSaudi ArabiaSenegalSerbiaSingaporeSlovak RepublicSloveniaSmall statesSouth AfricaSouth AsiaSouth Asia (IDA & IBRD)South SudanSpainSri LankaSub-Saharan Africa Sub-Saharan Africa (excluding high income)Sub-Saharan Africa (IDA & IBRD countries)SudanSwedenSwitzerlandSyrian Arab RepublicTajikistanTanzaniaThailandTogoTrinidad and TobagoTunisiaTurkeyTurkmenistanUkraineUnited Arab EmiratesUnited KingdomUnited StatesUpper middle incomeUruguayUzbekistanVenezuela, RBVietnamWorldYemen, Rep.ZambiaZimbabwe línea de tiempo (timeline):
En esta escala de tiempo se presenta un gráfico de 1961 y 2014 de IDA & IBRD total. Los datos de 1960 están ausentes. El número de observaciones reales por fecha: 54.
Fuente (nombre):
Indicadores del desarrollo mundial
Fuente (organización):
IEA Statistics © OECD/IEA 2014 (http://www.iea.org/stats/index.asp), subject to https://www.iea.org/t&c/termsandconditions/
Categorías:
Energy & Mining, Climate Change, Environment
Se ha actualizado:
23 abr 2017 año
Los indicadores de los cambios de valor en los últimos años
Mínimo:
51.0 millones
1 ene 1961 año
Máximo:
406.857 bn
1 ene 2014 año
A la fecha de observación
Valor
Cambio absoluto
El cambio con respecto al valor anterior
1 ene 1961 año
51.0 millones
+51.0 millones
0.0%
1 ene 1962 año
55.0 millones
+4.0 millones
7.84%
1 ene 1963 año
63.0 millones
+8.0 millones
14.55%
1 ene 1964 año
77.0 millones
+14.0 millones
22.22%
1 ene 1965 año
113.0 millones
+36.0 millones
46.75%
1 ene 1966 año
126.0 millones
+13.0 millones
11.5%
1 ene 1967 año
160.0 millones
+34.0 millones
26.98%
1 ene 1968 año
217.0 millones
+57.0 millones
35.62%
1 ene 1969 año
226.0 millones
+9.0 millones
4.15%
1 ene 1970 año
262.0 millones
+36.0 millones
15.93%
1 ene 1971 año
225.0 millones
-37.0 millones
-14.12%
1 ene 1972 año
1.725 bn
+1.5 bn
666.67%
1 ene 1973 año
1.954 bn
+229.0 millones
13.28%
1 ene 1974 año
2.281 bn
+327.0 millones
16.73%
1 ene 1975 año
2.684 bn
+403.0 millones
17.67%
1 ene 1976 año
3.187 bn
+503.0 millones
18.74%
1 ene 1977 año
3.653 bn
+466.0 millones
14.62%
1 ene 1978 año
4.074 bn
+421.0 millones
11.52%
1 ene 1979 año
4.302 bn
+228.0 millones
5.6%
1 ene 1980 año
5.628 bn
+1.326 bn
30.82%
1 ene 1981 año
6.972 bn
+1.344 bn
23.88%
1 ene 1982 año
8.494 bn
+1.522 bn
21.83%
1 ene 1983 año
10.176 bn
+1.682 bn
19.8%
1 ene 1984 año
12.295 bn
+2.119 bn
20.82%
1 ene 1985 año
12.592 bn
+297.0 millones
2.42%
1 ene 1986 año
13.375 bn
+783.0 millones
6.22%
1 ene 1987 año
15.324 bn
+1.949 bn
14.57%
1 ene 1988 año
16.436 bn
+1.112 bn
7.26%
1 ene 1989 año
17.033 bn
+597.0 millones
3.63%
1 ene 1990 año
17.88 bn
+847.0 millones
4.97%
1 ene 1991 año
20.064 bn
+2.184 bn
12.21%
1 ene 1992 año
22.003 bn
+1.939 bn
9.66%
1 ene 1993 año
25.3 bn
+3.297 bn
14.98%
1 ene 1994 año
25.626 bn
+326.0 millones
1.29%
1 ene 1995 año
27.749 bn
+2.123 bn
8.28%
1 ene 1996 año
32.35 bn
+4.601 bn
16.58%
1 ene 1997 año
32.873 bn
+523.0 millones
1.62%
1 ene 1998 año
35.505 bn
+2.632 bn
8.01%
1 ene 1999 año
37.134 bn
+1.629 bn
4.59%
1 ene 2000 año
41.874 bn
+4.74 bn
12.76%
1 ene 2001 año
46.415 bn
+4.541 bn
10.84%
1 ene 2002 año
51.187 bn
+4.772 bn
10.28%
1 ene 2003 año
54.058 bn
+2.871 bn
5.61%
1 ene 2004 año
59.618 bn
+5.56 bn
10.29%
1 ene 2005 año
65.325 bn
+5.707 bn
9.57%
1 ene 2006 año
74.711 bn
+9.386 bn
14.37%
1 ene 2007 año
85.4 bn
+10.689 bn
14.31%
1 ene 2008 año
102.219 bn
+16.819 bn
19.69%
1 ene 2009 año
128.308 bn
+26.089 bn
25.52%
1 ene 2010 año
164.853 bn
+36.545 bn
28.48%
1 ene 2011 año
208.202 bn
+43.349 bn
26.3%
1 ene 2012 año
262.891 bn
+54.689 bn
26.27%
1 ene 2013 año
323.285 bn
+60.394 bn
22.97%
1 ene 2014 año
406.857 bn
+83.572 bn
25.85%
Ranking de los países por los datos estadísticos actuales


Comentarios: