29
/es/
es
AIzaSyAYiBZKx7MnpbEhh9jyipgxe19OcubqV5w
April 1, 2024
36296
High income
HIC
false
2
1
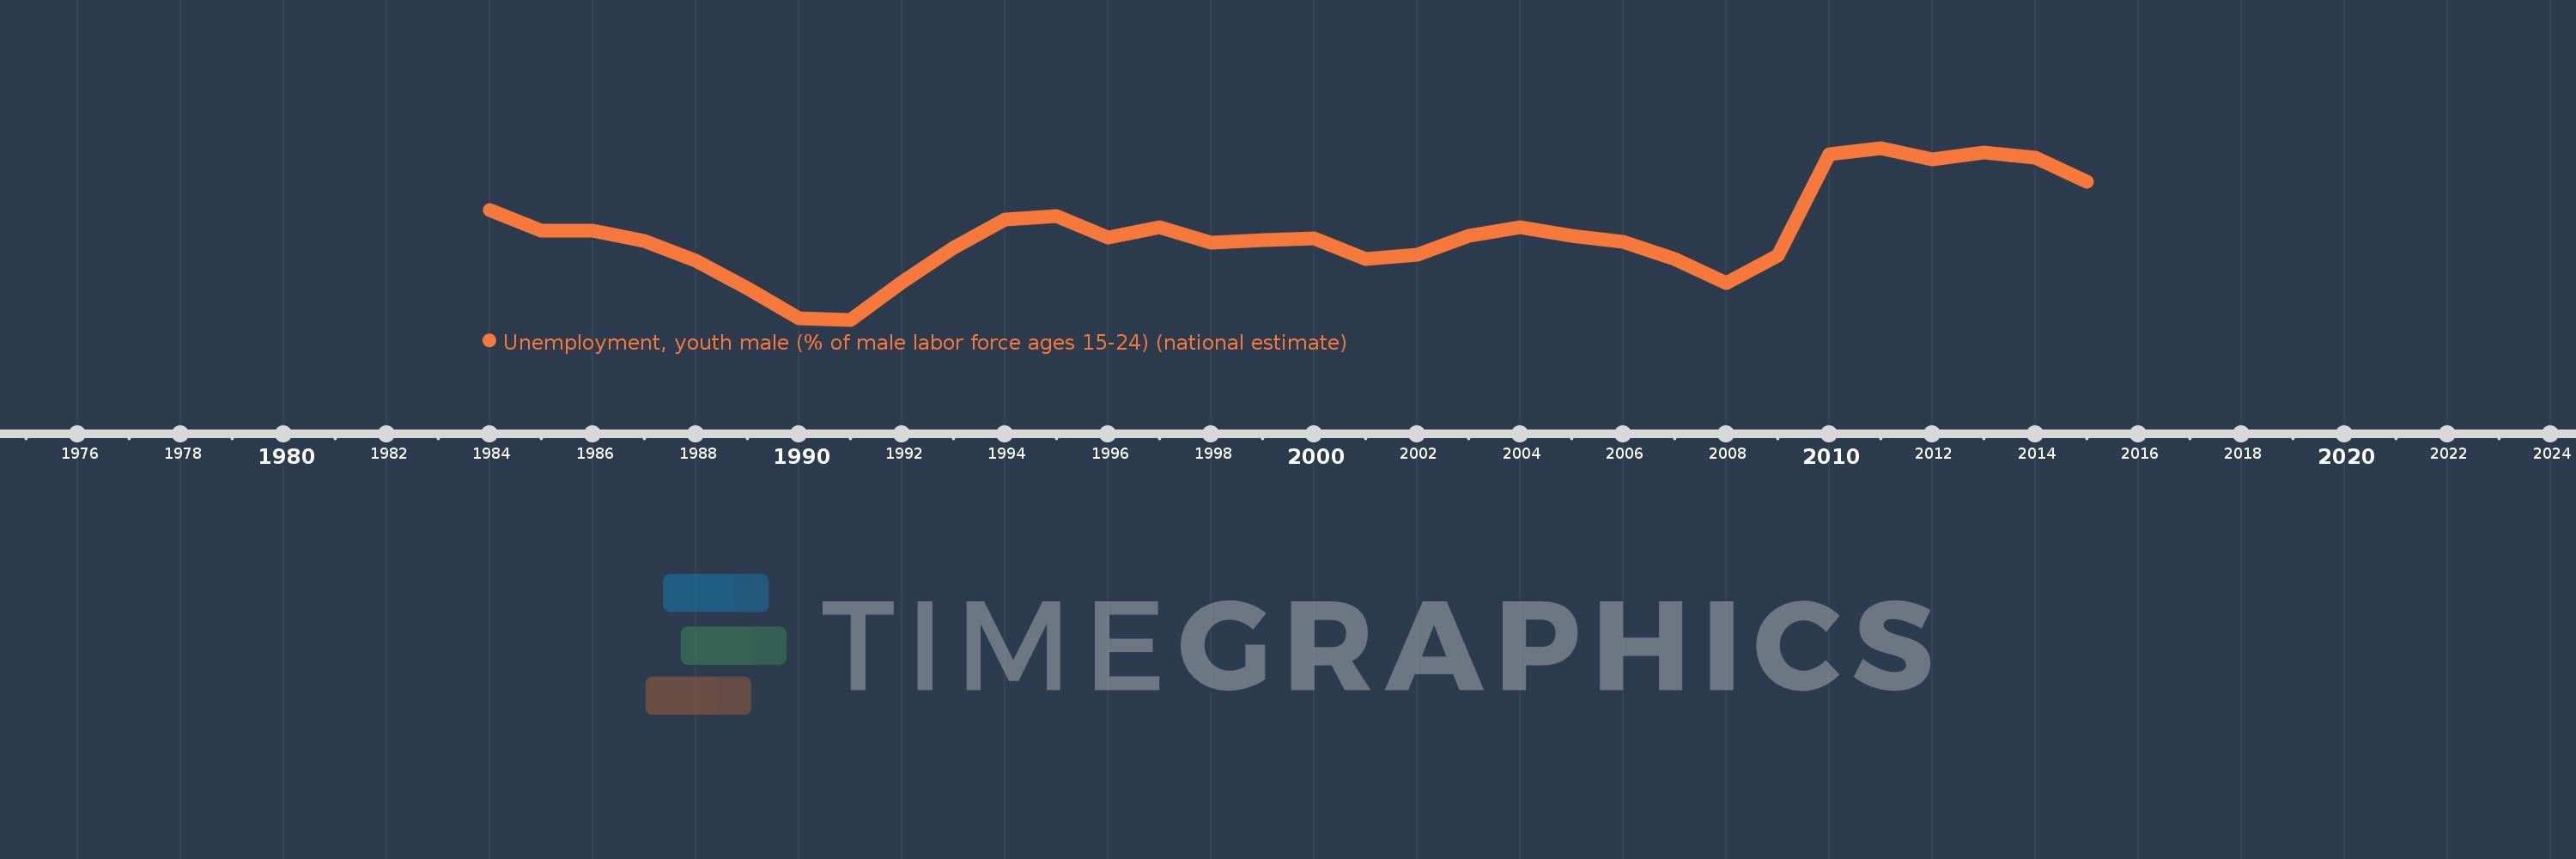
Unemployment, youth male (% of male labor force ages 15-24) (national estimate)
2015,2014,2013,2012,2011,2010,2009,2008,2007,2006,2005,2004,2003,2002,2001,2000,1999,1998,1997,1996,1995,1994,1993,1992,1991,1990,1989,1988,1987,1986,1985,1984
Estas estadísticas en otros países:
AlbaniaAlgeriaAmerican SamoaAntigua and BarbudaArab WorldArgentinaArmeniaArubaAustraliaAustriaAzerbaijanBahamas, TheBahrainBangladeshBarbadosBelarusBelgiumBelizeBeninBermudaBhutanBoliviaBosnia and HerzegovinaBotswanaBrazilBritish Virgin IslandsBulgariaBurkina FasoBurundiCabo VerdeCambodiaCameroonCanadaCaribbean small statesCayman IslandsCentral Europe and the BalticsChileColombiaCosta RicaCroatiaCubaCyprusCzech RepublicDenmarkDominicaDominican RepublicEarly-demographic dividendEcuadorEgypt, Arab Rep.El SalvadorEstoniaEthiopiaEuro areaEurope & Central AsiaEurope & Central Asia (excluding high income)Europe & Central Asia (IDA & IBRD countries)European UnionFaroe IslandsFijiFinlandFranceFrench PolynesiaGabonGambia, TheGeorgiaGermanyGhanaGreeceGrenadaGuamGuatemalaGuineaGuyanaHaitiHigh incomeHondurasHong Kong SAR, ChinaHungaryIcelandIndiaIndonesiaIran, Islamic Rep.IrelandIsle of ManIsraelItalyJamaicaJapanJordanKazakhstanKiribatiKorea, Rep.KosovoKuwaitKyrgyz RepublicLao PDRLatin America & Caribbean Latin America & Caribbean (excluding high income)Latin America & the Caribbean (IDA & IBRD countries)LatviaLebanonLesothoLiberiaLibyaLithuaniaLower middle incomeLuxembourgMacao SAR, ChinaMacedonia, FYRMadagascarMalawiMalaysiaMaldivesMaliMaltaMarshall IslandsMauritiusMexicoMiddle East & North AfricaMiddle East & North Africa (excluding high income)Middle East & North Africa (IDA & IBRD countries)MoldovaMonacoMongoliaMontenegroMoroccoMozambiqueNamibiaNauruNepalNetherlandsNew ZealandNicaraguaNigerNigeriaNorth AmericaNorthern Mariana IslandsNorwayOECD membersPakistanPalauPanamaParaguayPeruPhilippinesPolandPortugalPost-demographic dividendPuerto RicoQatarRomaniaRussian FederationRwandaSamoaSan MarinoSao Tome and PrincipeSaudi ArabiaSenegalSerbiaSeychellesSierra LeoneSingaporeSlovak RepublicSloveniaSolomon IslandsSouth AfricaSouth AsiaSouth Asia (IDA & IBRD)South SudanSpainSri LankaSt. Kitts and NevisSt. LuciaSt. Vincent and the GrenadinesSudanSurinameSwazilandSwedenSwitzerlandSyrian Arab RepublicTajikistanTanzaniaThailandTimor-LesteTongaTrinidad and TobagoTunisiaTurkeyUgandaUkraineUnited Arab EmiratesUnited KingdomUnited StatesUruguayVanuatuVenezuela, RBVietnamWest Bank and GazaYemen, Rep.ZambiaZimbabwe línea de tiempo (timeline):
En esta escala de tiempo se presenta un gráfico de 1984 y 2015 de High income. Los datos de 1983 están ausentes. El número de observaciones reales por fecha: 32.
Fuente (nombre):
Indicadores del desarrollo mundial
Fuente (organización):
International Labour Organization, Key Indicators of the Labour Market database.
Categorías:
Social Protection & Labor
Se ha actualizado:
23 abr 2017 año
Los indicadores de los cambios de valor en los últimos años
Mínimo:
11.759
1 ene 1991 año
Máximo:
19.319
1 ene 2011 año
A la fecha de observación
Valor
Cambio absoluto
El cambio con respecto al valor anterior
1 ene 1984 año
16.594
+16.594
0.0%
1 ene 1985 año
15.688
-0.906
-5.46%
1 ene 1986 año
15.675
-0.013
-0.08%
1 ene 1987 año
15.207
-0.469
-2.99%
1 ene 1988 año
14.344
-0.863
-5.68%
1 ene 1989 año
13.152
-1.192
-8.31%
1 ene 1990 año
11.815
-1.336
-10.16%
1 ene 1991 año
11.759
-0.056
-0.48%
1 ene 1992 año
13.392
+1.633
13.89%
1 ene 1993 año
14.928
+1.536
11.47%
1 ene 1994 año
16.156
+1.229
8.23%
1 ene 1995 año
16.328
+0.171
1.06%
1 ene 1996 año
15.379
-0.948
-5.81%
1 ene 1997 año
15.831
+0.452
2.94%
1 ene 1998 año
15.163
-0.669
-4.22%
1 ene 1999 año
15.266
+0.104
0.68%
1 ene 2000 año
15.324
+0.058
0.38%
1 ene 2001 año
14.431
-0.893
-5.83%
1 ene 2002 año
14.613
+0.182
1.26%
1 ene 2003 año
15.469
+0.856
5.86%
1 ene 2004 año
15.847
+0.378
2.45%
1 ene 2005 año
15.47
-0.377
-2.38%
1 ene 2006 año
15.19
-0.279
-1.81%
1 ene 2007 año
14.425
-0.765
-5.04%
1 ene 2008 año
13.38
-1.046
-7.25%
1 ene 2009 año
14.578
+1.198
8.95%
1 ene 2010 año
19.04
+4.462
30.61%
1 ene 2011 año
19.319
+0.279
1.46%
1 ene 2012 año
18.818
-0.501
-2.59%
1 ene 2013 año
19.102
+0.284
1.51%
1 ene 2014 año
18.893
-0.209
-1.09%
1 ene 2015 año
17.817
-1.076
-5.7%
Ranking de los países por los datos estadísticos actuales


Comentarios: