29
/es/
es
AIzaSyAYiBZKx7MnpbEhh9jyipgxe19OcubqV5w
April 1, 2024
35776
High income
HIC
false
2
1
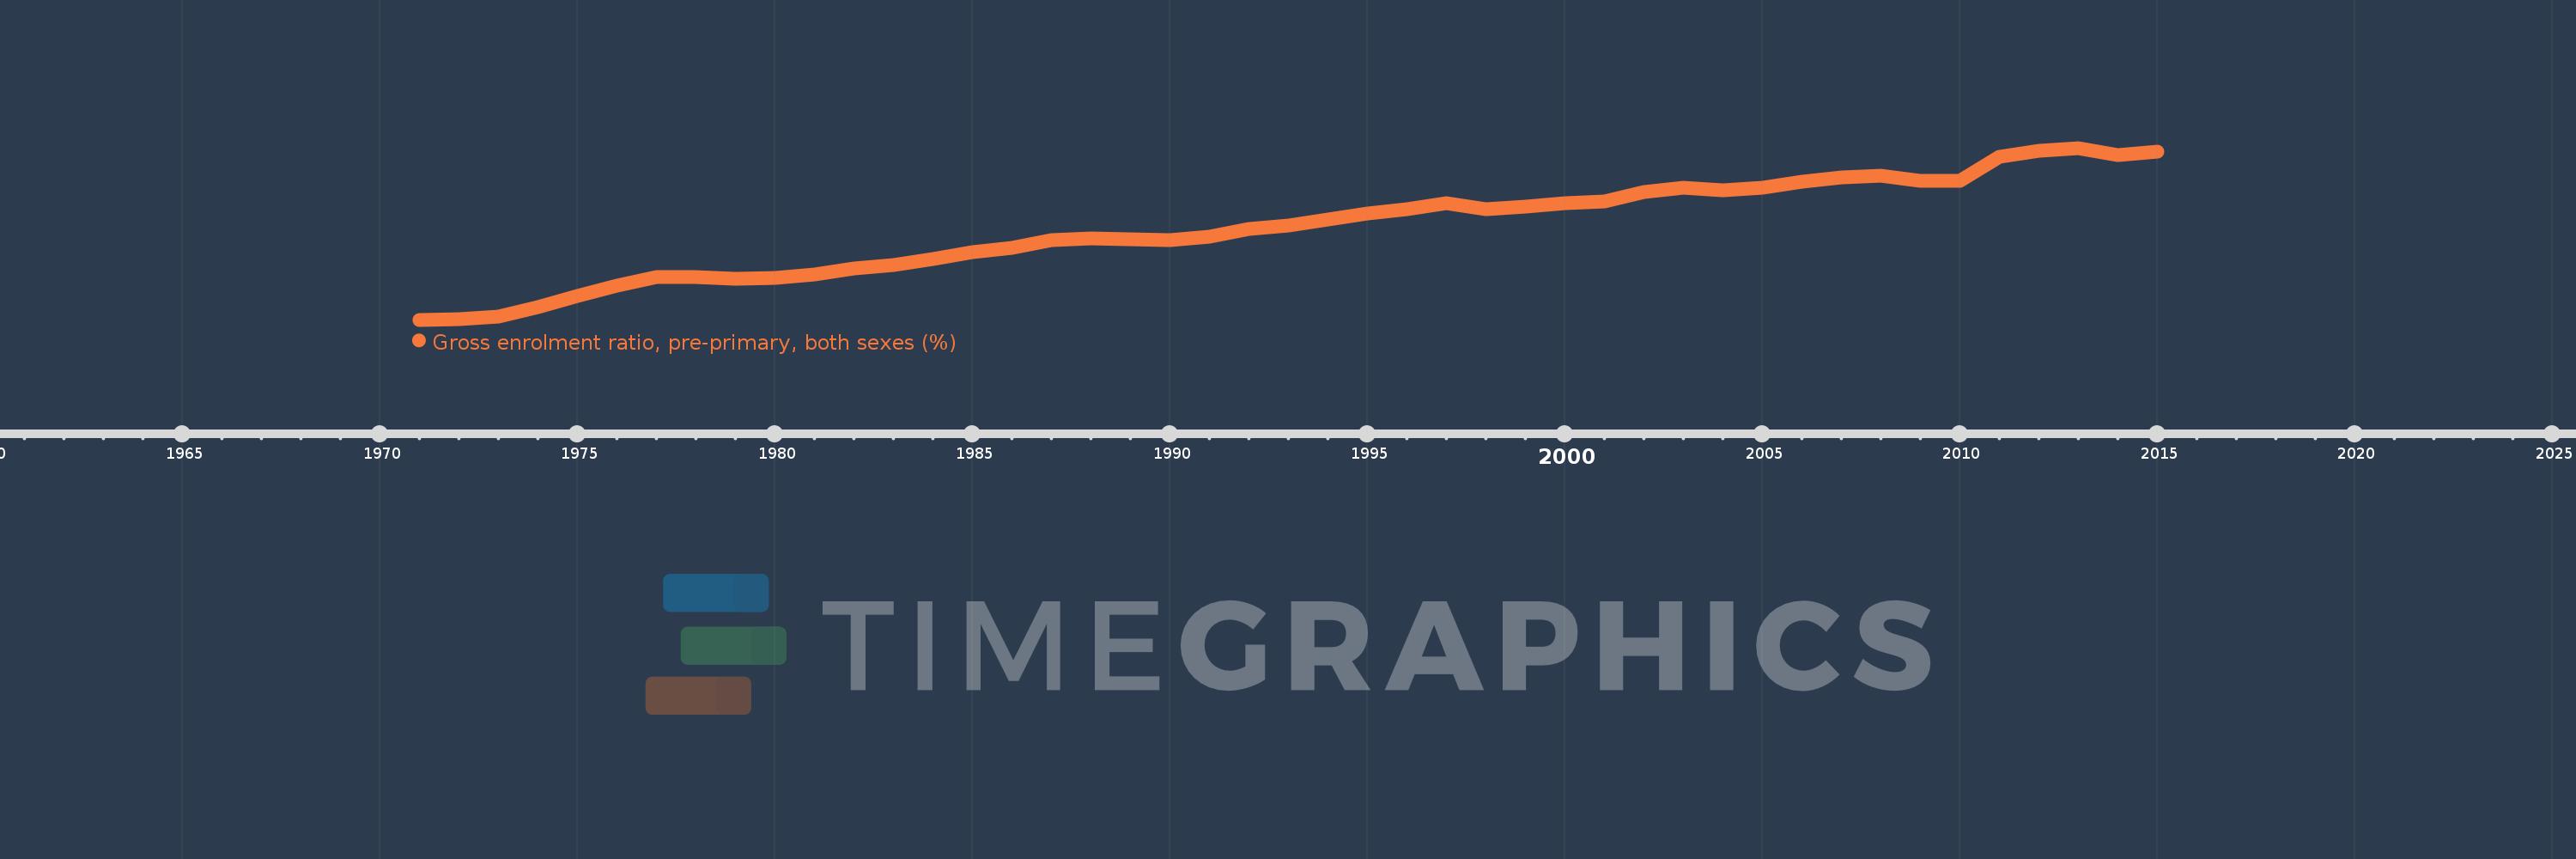
Gross enrolment ratio, pre-primary, both sexes (%)
2015,2014,2013,2012,2011,2010,2009,2008,2007,2006,2005,2004,2003,2002,2001,2000,1999,1998,1997,1996,1995,1994,1993,1992,1991,1990,1989,1988,1987,1986,1985,1984,1983,1982,1981,1980,1979,1978,1977,1976,1975,1974,1973,1972,1971
Estas estadísticas en otros países:
AfghanistanAlbaniaAlgeriaAndorraAngolaAntigua and BarbudaArab WorldArgentinaArmeniaArubaAustraliaAustriaAzerbaijanBahamas, TheBahrainBangladeshBarbadosBelarusBelgiumBelizeBeninBermudaBhutanBoliviaBosnia and HerzegovinaBotswanaBrazilBritish Virgin IslandsBrunei DarussalamBulgariaBurkina FasoBurundiCabo VerdeCambodiaCameroonCanadaCaribbean small statesCentral African RepublicCentral Europe and the BalticsChadChileChinaColombiaComorosCongo, Dem. Rep.Congo, Rep.Costa RicaCote d'IvoireCroatiaCubaCyprusCzech RepublicDenmarkDjiboutiDominicaDominican RepublicEarly-demographic dividendEast Asia & PacificEast Asia & Pacific (excluding high income)East Asia & Pacific (IDA & IBRD countries)EcuadorEgypt, Arab Rep.El SalvadorEquatorial GuineaEritreaEstoniaEthiopiaEuro areaEurope & Central AsiaEurope & Central Asia (excluding high income)Europe & Central Asia (IDA & IBRD countries)European UnionFijiFinlandFragile and conflict affected situationsFranceGabonGambia, TheGeorgiaGermanyGhanaGreeceGrenadaGuatemalaGuineaGuinea-BissauGuyanaHaitiHeavily indebted poor countries (HIPC)High incomeHondurasHong Kong SAR, ChinaHungaryIBRD onlyIcelandIDA & IBRD totalIDA blendIDA onlyIDA totalIndiaIndonesiaIran, Islamic Rep.IraqIrelandIsraelItalyJamaicaJapanJordanKazakhstanKenyaKiribatiKorea, Dem. People’s Rep.Korea, Rep.KuwaitKyrgyz RepublicLao PDRLate-demographic dividendLatin America & Caribbean Latin America & Caribbean (excluding high income)Latin America & the Caribbean (IDA & IBRD countries)LatviaLeast developed countries: UN classificationLebanonLesothoLiberiaLibyaLiechtensteinLithuaniaLow & middle incomeLow incomeLower middle incomeLuxembourgMacao SAR, ChinaMacedonia, FYRMadagascarMalaysiaMaldivesMaliMaltaMarshall IslandsMauritaniaMauritiusMexicoMicronesia, Fed. Sts.Middle East & North AfricaMiddle East & North Africa (excluding high income)Middle East & North Africa (IDA & IBRD countries)Middle incomeMoldovaMongoliaMontenegroMoroccoMozambiqueMyanmarNamibiaNauruNepalNetherlandsNew ZealandNicaraguaNigerNigeriaNorth AmericaNorwayOECD membersOmanOther small statesPacific island small statesPakistanPalauPanamaPapua New GuineaParaguayPeruPhilippinesPolandPortugalPost-demographic dividendPre-demographic dividendPuerto RicoQatarRomaniaRussian FederationRwandaSamoaSan MarinoSao Tome and PrincipeSaudi ArabiaSenegalSerbiaSeychellesSierra LeoneSlovak RepublicSloveniaSmall statesSolomon IslandsSomaliaSouth AfricaSouth AsiaSouth Asia (IDA & IBRD)South SudanSpainSri LankaSt. Kitts and NevisSt. LuciaSt. Vincent and the GrenadinesSub-Saharan Africa Sub-Saharan Africa (excluding high income)Sub-Saharan Africa (IDA & IBRD countries)SudanSurinameSwazilandSwedenSwitzerlandSyrian Arab RepublicTajikistanTanzaniaThailandTimor-LesteTogoTongaTrinidad and TobagoTunisiaTurkeyTurkmenistanTuvaluUgandaUkraineUnited Arab EmiratesUnited KingdomUnited StatesUpper middle incomeUruguayUzbekistanVanuatuVenezuela, RBVietnamWest Bank and GazaWorldYemen, Rep.ZambiaZimbabwe línea de tiempo (timeline):
En esta escala de tiempo se presenta un gráfico de 1971 y 2015 de High income. Los datos de 1970 están ausentes. El número de observaciones reales por fecha: 45.
Fuente (nombre):
Indicadores del desarrollo mundial
Fuente (organización):
UNESCO Institute for Statistics
Categorías:
Education
Se ha actualizado:
23 abr 2017 año
Los indicadores de los cambios de valor en los últimos años
Mínimo:
46.591
1 ene 1971 año
Máximo:
84.231
1 ene 2013 año
A la fecha de observación
Valor
Cambio absoluto
El cambio con respecto al valor anterior
1 ene 1971 año
46.591
+46.591
0.0%
1 ene 1972 año
46.791
+0.2
0.43%
1 ene 1973 año
47.291
+0.5
1.07%
1 ene 1974 año
49.273
+1.982
4.19%
1 ene 1975 año
51.758
+2.485
5.04%
1 ene 1976 año
53.996
+2.238
4.32%
1 ene 1977 año
55.9
+1.904
3.53%
1 ene 1978 año
56.035
+0.135
0.24%
1 ene 1979 año
55.595
-0.439
-0.78%
1 ene 1980 año
55.781
+0.185
0.33%
1 ene 1981 año
56.422
+0.641
1.15%
1 ene 1982 año
57.87
+1.448
2.57%
1 ene 1983 año
58.537
+0.668
1.15%
1 ene 1984 año
59.93
+1.392
2.38%
1 ene 1985 año
61.474
+1.545
2.58%
1 ene 1986 año
62.267
+0.793
1.29%
1 ene 1987 año
64.017
+1.75
2.81%
1 ene 1988 año
64.345
+0.328
0.51%
1 ene 1989 año
64.301
-0.045
-0.07%
1 ene 1990 año
64.015
-0.285
-0.44%
1 ene 1991 año
64.874
+0.859
1.34%
1 ene 1992 año
66.45
+1.576
2.43%
1 ene 1993 año
67.288
+0.838
1.26%
1 ene 1994 año
68.512
+1.224
1.82%
1 ene 1995 año
69.838
+1.326
1.94%
1 ene 1996 año
70.779
+0.941
1.35%
1 ene 1997 año
72.184
+1.406
1.99%
1 ene 1998 año
70.768
-1.416
-1.96%
1 ene 1999 año
71.289
+0.521
0.74%
1 ene 2000 año
72.175
+0.886
1.24%
1 ene 2001 año
72.555
+0.381
0.53%
1 ene 2002 año
74.66
+2.105
2.9%
1 ene 2003 año
75.604
+0.944
1.26%
1 ene 2004 año
74.98
-0.624
-0.83%
1 ene 2005 año
75.511
+0.531
0.71%
1 ene 2006 año
76.842
+1.331
1.76%
1 ene 2007 año
77.764
+0.923
1.2%
1 ene 2008 año
78.073
+0.309
0.4%
1 ene 2009 año
77.102
-0.971
-1.24%
1 ene 2010 año
77.009
-0.093
-0.12%
1 ene 2011 año
82.374
+5.365
6.97%
1 ene 2012 año
83.583
+1.209
1.47%
1 ene 2013 año
84.231
+0.648
0.78%
1 ene 2014 año
82.682
-1.549
-1.84%
1 ene 2015 año
83.415
+0.732
0.89%
Ranking de los países por los datos estadísticos actuales


Comentarios: