29
/es/
es
AIzaSyAYiBZKx7MnpbEhh9jyipgxe19OcubqV5w
April 1, 2024
35669
High income
HIC
false
2
1
Employment to population ratio, 15+, male (%) (national estimate)
2015,2014,2013,2012,2011,2010,2009,2008,2007,2006,2005,2004,2003,2002,2001,2000,1999,1998,1997,1996,1995,1994,1993,1992,1991,1990,1989,1988,1987,1986,1985,1984
Estas estadísticas en otros países:
AfghanistanAlbaniaAlgeriaAmerican SamoaAntigua and BarbudaArab WorldArgentinaArmeniaArubaAustraliaAustriaAzerbaijanBahamas, TheBahrainBangladeshBarbadosBelarusBelgiumBelizeBeninBermudaBhutanBoliviaBosnia and HerzegovinaBotswanaBrazilBritish Virgin IslandsBrunei DarussalamBulgariaBurkina FasoBurundiCambodiaCameroonCanadaCaribbean small statesCayman IslandsCentral Europe and the BalticsChadChileColombiaCongo, Dem. Rep.Congo, Rep.Costa RicaCroatiaCubaCyprusCzech RepublicDenmarkDjiboutiDominicaDominican RepublicEarly-demographic dividendEcuadorEgypt, Arab Rep.El SalvadorEstoniaEthiopiaEuro areaEurope & Central AsiaEurope & Central Asia (excluding high income)Europe & Central Asia (IDA & IBRD countries)European UnionFaroe IslandsFijiFinlandFranceFrench PolynesiaGabonGambia, TheGeorgiaGermanyGhanaGreeceGrenadaGuamGuatemalaGuineaGuyanaHaitiHigh incomeHondurasHong Kong SAR, ChinaHungaryIcelandIndiaIndonesiaIran, Islamic Rep.IraqIrelandIsle of ManIsraelItalyJamaicaJapanJordanKazakhstanKenyaKiribatiKorea, Rep.KosovoKuwaitKyrgyz RepublicLao PDRLatin America & Caribbean Latin America & Caribbean (excluding high income)Latin America & the Caribbean (IDA & IBRD countries)LatviaLebanonLesothoLiberiaLibyaLithuaniaLower middle incomeLuxembourgMacao SAR, ChinaMacedonia, FYRMadagascarMalawiMalaysiaMaldivesMaliMaltaMarshall IslandsMauritaniaMauritiusMexicoMiddle East & North AfricaMiddle East & North Africa (excluding high income)Middle East & North Africa (IDA & IBRD countries)MoldovaMonacoMongoliaMontenegroMoroccoMozambiqueNamibiaNepalNetherlandsNew CaledoniaNew ZealandNicaraguaNigerNigeriaNorth AmericaNorthern Mariana IslandsNorwayOECD membersOmanPakistanPanamaParaguayPeruPhilippinesPolandPortugalPost-demographic dividendPuerto RicoQatarRomaniaRussian FederationRwandaSamoaSan MarinoSao Tome and PrincipeSaudi ArabiaSenegalSerbiaSeychellesSierra LeoneSingaporeSlovak RepublicSloveniaSolomon IslandsSouth AfricaSouth AsiaSouth Asia (IDA & IBRD)South SudanSpainSri LankaSt. Kitts and NevisSt. LuciaSudanSurinameSwazilandSwedenSwitzerlandSyrian Arab RepublicTajikistanTanzaniaThailandTimor-LesteTogoTongaTrinidad and TobagoTunisiaTurkeyTuvaluUgandaUkraineUnited Arab EmiratesUnited KingdomUnited StatesUruguayVanuatuVenezuela, RBVietnamWest Bank and GazaYemen, Rep.ZambiaZimbabwe línea de tiempo (timeline):
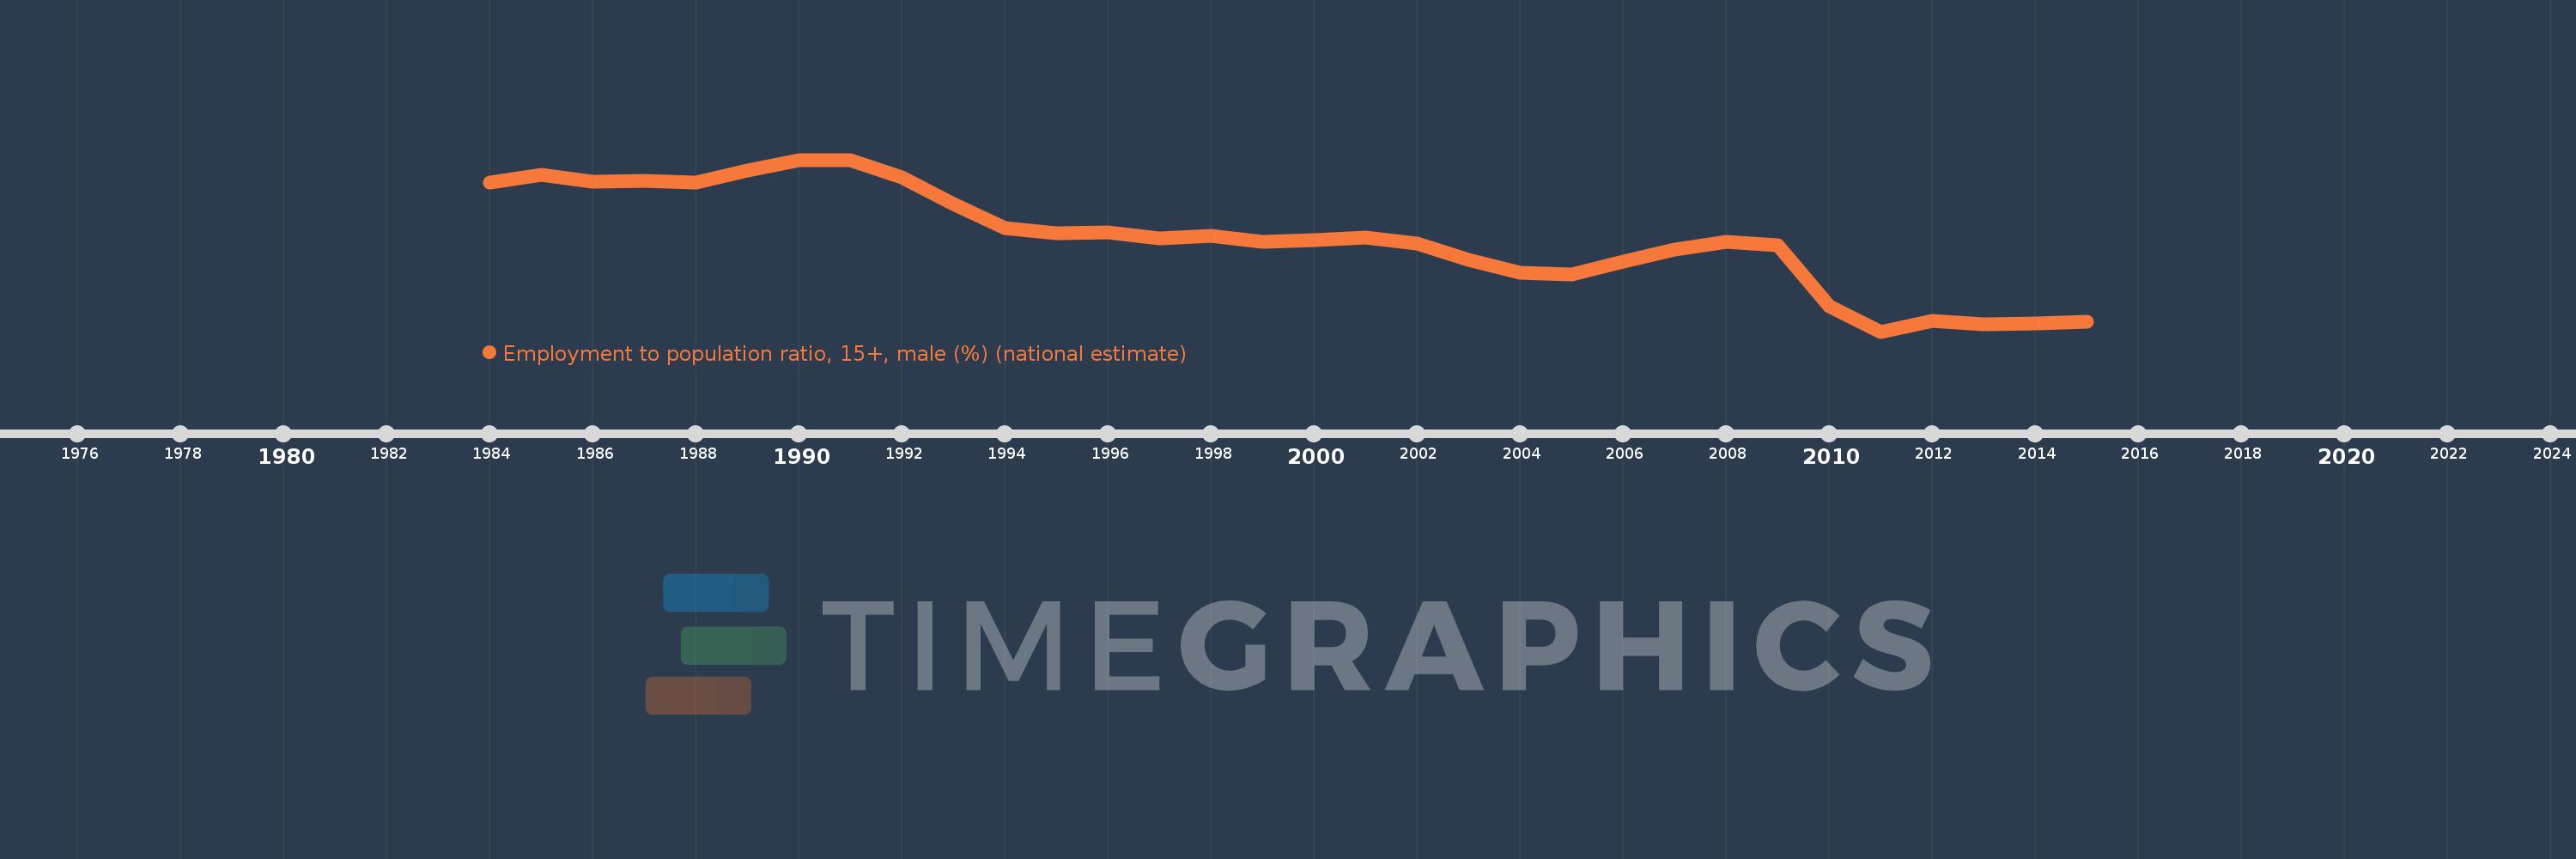
En esta escala de tiempo se presenta un gráfico de 1984 y 2015 de High income. Los datos de 1983 están ausentes. El número de observaciones reales por fecha: 32.
Fuente (nombre):
Indicadores del desarrollo mundial
Fuente (organización):
International Labour Organization, Key Indicators of the Labour Market database.
Categorías:
Social Protection & Labor
Se ha actualizado:
23 abr 2017 año
Los indicadores de los cambios de valor en los últimos años
Mínimo:
62.648
1 ene 2011 año
Máximo:
69.363
1 ene 1990 año
A la fecha de observación
Valor
Cambio absoluto
El cambio con respecto al valor anterior
1 ene 1984 año
68.457
+68.457
0.0%
1 ene 1985 año
68.76
+0.304
0.44%
1 ene 1986 año
68.51
-0.251
-0.36%
1 ene 1987 año
68.528
+0.018
0.03%
1 ene 1988 año
68.483
-0.045
-0.07%
1 ene 1989 año
68.955
+0.472
0.69%
1 ene 1990 año
69.363
+0.408
0.59%
1 ene 1991 año
69.341
-0.023
-0.03%
1 ene 1992 año
68.665
-0.676
-0.97%
1 ene 1993 año
67.631
-1.034
-1.51%
1 ene 1994 año
66.701
-0.93
-1.38%
1 ene 1995 año
66.485
-0.216
-0.32%
1 ene 1996 año
66.522
+0.037
0.06%
1 ene 1997 año
66.278
-0.245
-0.37%
1 ene 1998 año
66.383
+0.105
0.16%
1 ene 1999 año
66.152
-0.231
-0.35%
1 ene 2000 año
66.222
+0.07
0.11%
1 ene 2001 año
66.327
+0.105
0.16%
1 ene 2002 año
66.076
-0.251
-0.38%
1 ene 2003 año
65.435
-0.64
-0.97%
1 ene 2004 año
64.964
-0.471
-0.72%
1 ene 2005 año
64.89
-0.074
-0.11%
1 ene 2006 año
65.39
+0.5
0.77%
1 ene 2007 año
65.844
+0.454
0.7%
1 ene 2008 año
66.16
+0.316
0.48%
1 ene 2009 año
66.037
-0.123
-0.19%
1 ene 2010 año
63.642
-2.394
-3.63%
1 ene 2011 año
62.648
-0.994
-1.56%
1 ene 2012 año
63.063
+0.415
0.66%
1 ene 2013 año
62.924
-0.139
-0.22%
1 ene 2014 año
62.962
+0.037
0.06%
1 ene 2015 año
63.028
+0.066
0.11%
Ranking de los países por los datos estadísticos actuales


Comentarios: