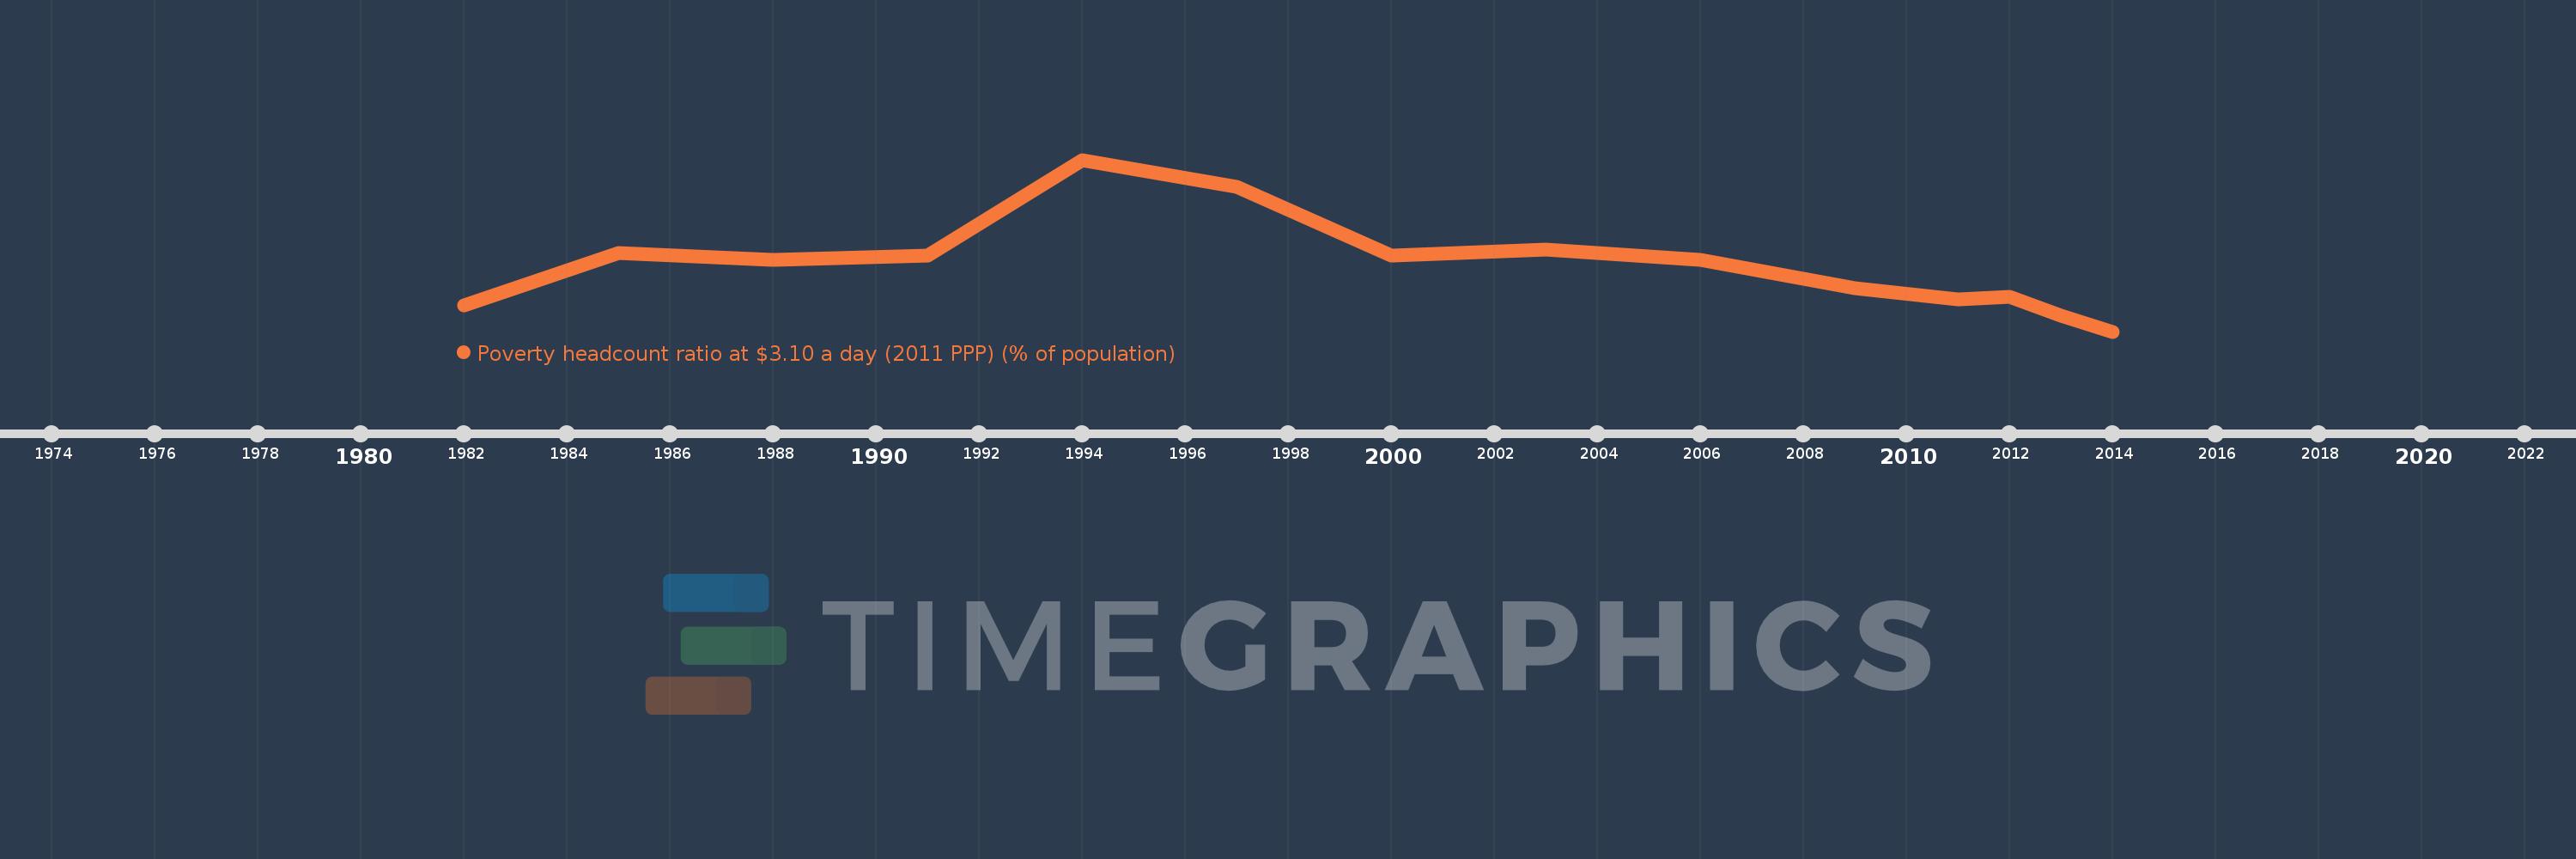
En esta escala de tiempo se presenta un gráfico de 1982 y 2014 de Fragile and conflict affected situations. Los datos de 1981 están ausentes. El número de observaciones reales por fecha: 14.
Fuente (nombre):
Indicadores del desarrollo mundial
Fuente (organización):
World Bank, Development Research Group. Data are based on primary household survey data obtained from government statistical agencies and World Bank country departments. Data for high-income economies are from the Luxembourg Income Study database. For more information and methodology, please see PovcalNet (http://iresearch.worldbank.org/PovcalNet/index.htm).
Categorías:
Poverty
Se ha actualizado:
23 abr 2017 año
Los indicadores de los cambios de valor en los últimos años
En promedio:
58.742
Mínimo:
55.24
1 ene 2014 año
Máximo:
64.33
1 ene 1994 año
A la fecha de observación
Valor
Cambio absoluto
El cambio con respecto al valor anterior
1 ene 1982 año
56.64
+56.64
0.0%
1 ene 1985 año
59.41
+2.77
4.89%
1 ene 1988 año
59.02
-0.39
-0.66%
1 ene 1991 año
59.25
+0.23
0.39%
1 ene 1994 año
64.33
+5.08
8.57%
1 ene 1997 año
62.92
-1.41
-2.19%
1 ene 2000 año
59.28
-3.64
-5.79%
1 ene 2003 año
59.59
+0.31
0.52%
1 ene 2006 año
59.05
-0.54
-0.91%
1 ene 2009 año
57.55
-1.5
-2.54%
1 ene 2011 año
56.95
-0.6
-1.04%
1 ene 2012 año
57.07
+0.12
0.21%
1 ene 2013 año
56.09
-0.98
-1.72%
1 ene 2014 año
55.24
-0.85
-1.52%
Ranking de los países por los datos estadísticos actuales
