29
/es/
es
AIzaSyAYiBZKx7MnpbEhh9jyipgxe19OcubqV5w
April 1, 2024
33577
European Union
EUU
false
2
1
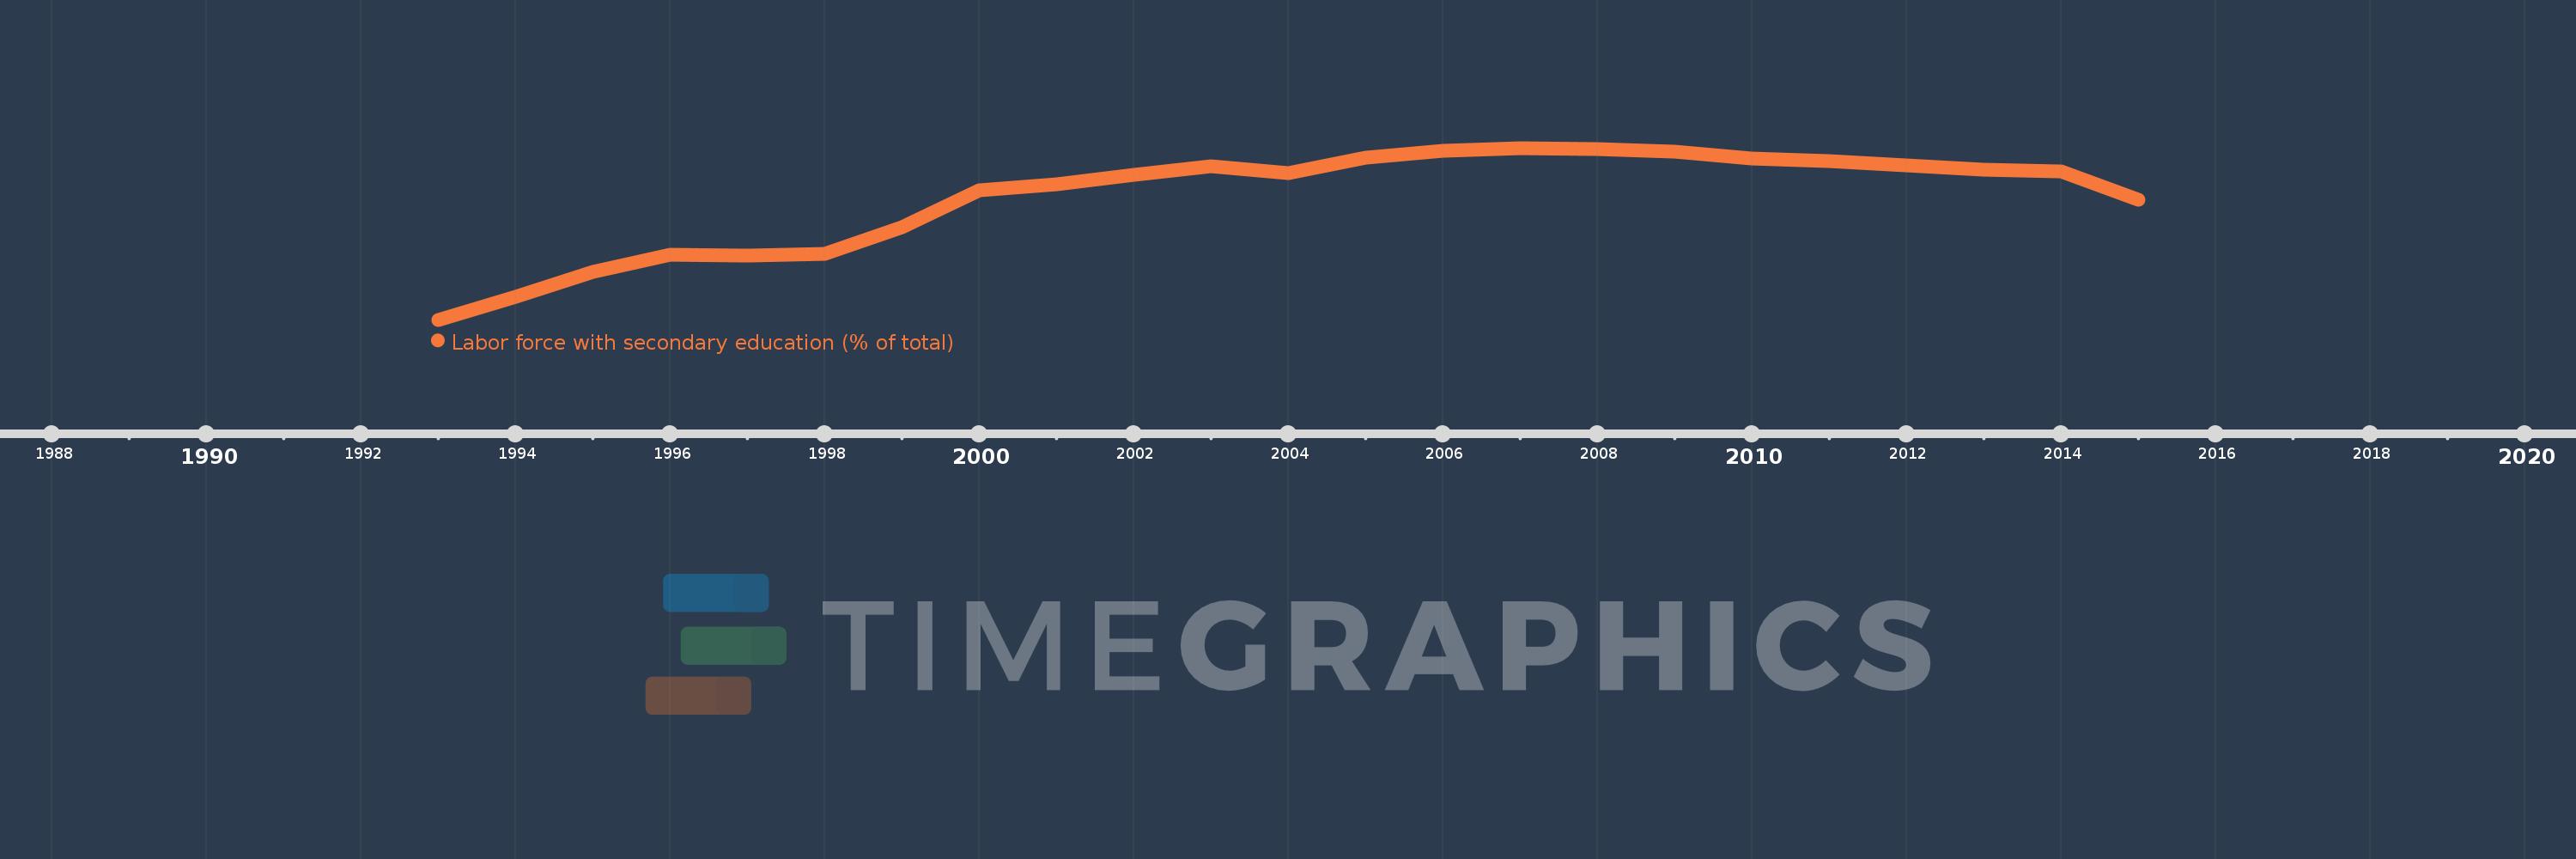
Labor force with secondary education (% of total)
2015,2014,2013,2012,2011,2010,2009,2008,2007,2006,2005,2004,2003,2002,2001,2000,1999,1998,1997,1996,1995,1994,1993
Estas estadísticas en otros países:
línea de tiempo (timeline):
En esta escala de tiempo se presenta un gráfico de 1993 y 2015 de European Union. Los datos de 1992 están ausentes. El número de observaciones reales por fecha: 23.
Fuente (nombre):
Indicadores del desarrollo mundial
Fuente (organización):
International Labour Organization, Key Indicators of the Labour Market database.
Categorías:
Education, Social Protection & Labor
Se ha actualizado:
23 abr 2017 año
Los indicadores de los cambios de valor en los últimos años
Mínimo:
41.043
1 ene 1993 año
Máximo:
51.137
1 ene 2007 año
A la fecha de observación
Valor
Cambio absoluto
El cambio con respecto al valor anterior
1 ene 1993 año
41.043
+41.043
0.0%
1 ene 1994 año
42.397
+1.355
3.3%
1 ene 1995 año
43.854
+1.457
3.44%
1 ene 1996 año
44.855
+1.0
2.28%
1 ene 1997 año
44.804
-0.05
-0.11%
1 ene 1998 año
44.9
+0.095
0.21%
1 ene 1999 año
46.477
+1.578
3.51%
1 ene 2000 año
48.668
+2.19
4.71%
1 ene 2001 año
49.025
+0.358
0.74%
1 ene 2002 año
49.56
+0.535
1.09%
1 ene 2003 año
50.039
+0.479
0.97%
1 ene 2004 año
49.656
-0.384
-0.77%
1 ene 2005 año
50.568
+0.912
1.84%
1 ene 2006 año
50.983
+0.416
0.82%
1 ene 2007 año
51.137
+0.154
0.3%
1 ene 2008 año
51.055
-0.082
-0.16%
1 ene 2009 año
50.915
-0.14
-0.27%
1 ene 2010 año
50.52
-0.394
-0.77%
1 ene 2011 año
50.379
-0.141
-0.28%
1 ene 2012 año
50.136
-0.243
-0.48%
1 ene 2013 año
49.867
-0.269
-0.54%
1 ene 2014 año
49.758
-0.11
-0.22%
1 ene 2015 año
48.088
-1.67
-3.36%
Ranking de los países por los datos estadísticos actuales


Comentarios: