29
/es/
es
AIzaSyAYiBZKx7MnpbEhh9jyipgxe19OcubqV5w
April 1, 2024
33461
European Union
EUU
false
2
1
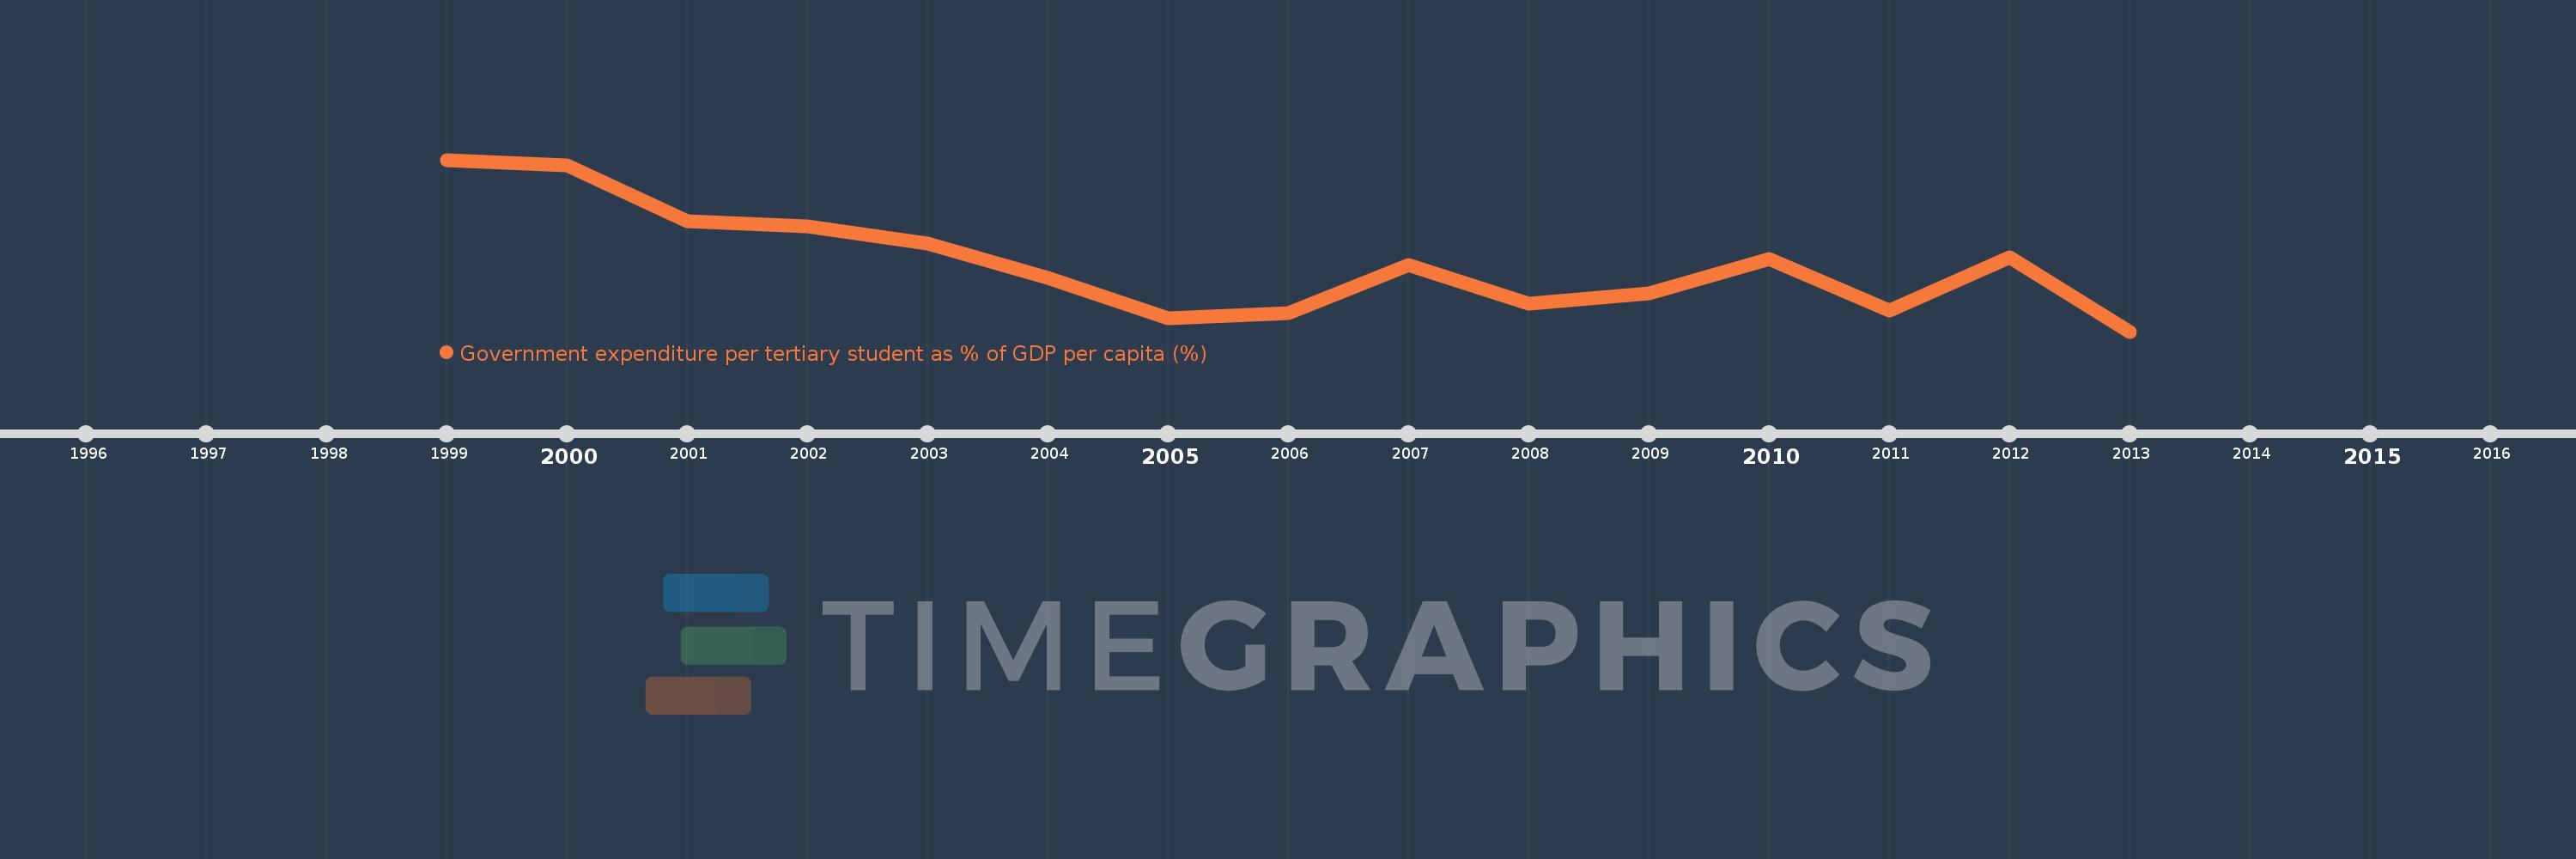
Government expenditure per tertiary student as % of GDP per capita (%)
2013,2012,2011,2010,2009,2008,2007,2006,2005,2004,2003,2002,2001,2000,1999
Estas estadísticas en otros países:
línea de tiempo (timeline):
En esta escala de tiempo se presenta un gráfico de 1999 y 2013 de European Union. Los datos de 1998 están ausentes. El número de observaciones reales por fecha: 15.
Fuente (nombre):
Indicadores del desarrollo mundial
Fuente (organización):
UNESCO Institute for Statistics
Categorías:
Education
Se ha actualizado:
23 abr 2017 año
Los indicadores de los cambios de valor en los últimos años
Mínimo:
23.686
1 ene 2013 año
Máximo:
31.632
1 ene 1999 año
A la fecha de observación
Valor
Cambio absoluto
El cambio con respecto al valor anterior
1 ene 1999 año
31.632
+31.632
0.0%
1 ene 2000 año
31.371
-0.261
-0.82%
1 ene 2001 año
28.784
-2.587
-8.25%
1 ene 2002 año
28.54
-0.245
-0.85%
1 ene 2003 año
27.761
-0.778
-2.73%
1 ene 2004 año
26.166
-1.595
-5.75%
1 ene 2005 año
24.314
-1.852
-7.08%
1 ene 2006 año
24.547
+0.233
0.96%
1 ene 2007 año
26.775
+2.228
9.08%
1 ene 2008 año
24.97
-1.805
-6.74%
1 ene 2009 año
25.472
+0.502
2.01%
1 ene 2010 año
27.062
+1.589
6.24%
1 ene 2011 año
24.64
-2.421
-8.95%
1 ene 2012 año
27.103
+2.462
9.99%
1 ene 2013 año
23.686
-3.417
-12.61%
Ranking de los países por los datos estadísticos actuales


Comentarios: